Products

RT2 Profiler PCR Arrays 旨在用于分子生物学应用。这些产品不能用于疾病诊断、预防和治疗。
Image
RT2 Profiler PCR Array

Cat. No. / ID:  330231

RT2 Profiler PCR Array
Copy order details
Image
RT2 RNA QC PCR Array

Cat. No. / ID:  330291

RT2 Profiler QC Array
Copy order details

Features

  • 检测一组基因的表达谱
  • 简单的real-time PCR方法具有高灵敏度
  • 只需1 ng总RNA
  • 可在各种real-time PCR分析仪上使用
  • 使用免费的在线工具进行便利的数据分析

Product Details

RT2 Profiler PCR Arrays是经优化的real-time PCR引物,可在96孔板、384孔板或100孔盘上,用于对通路或疾病相关的基因进行分析,并含有相应的RNA质量控制。RT2 Profiler PCR Arrays进行的基因表达分析具有real-time PCR的灵敏度和微阵列的多基因检测能力。

Performance

灵敏度

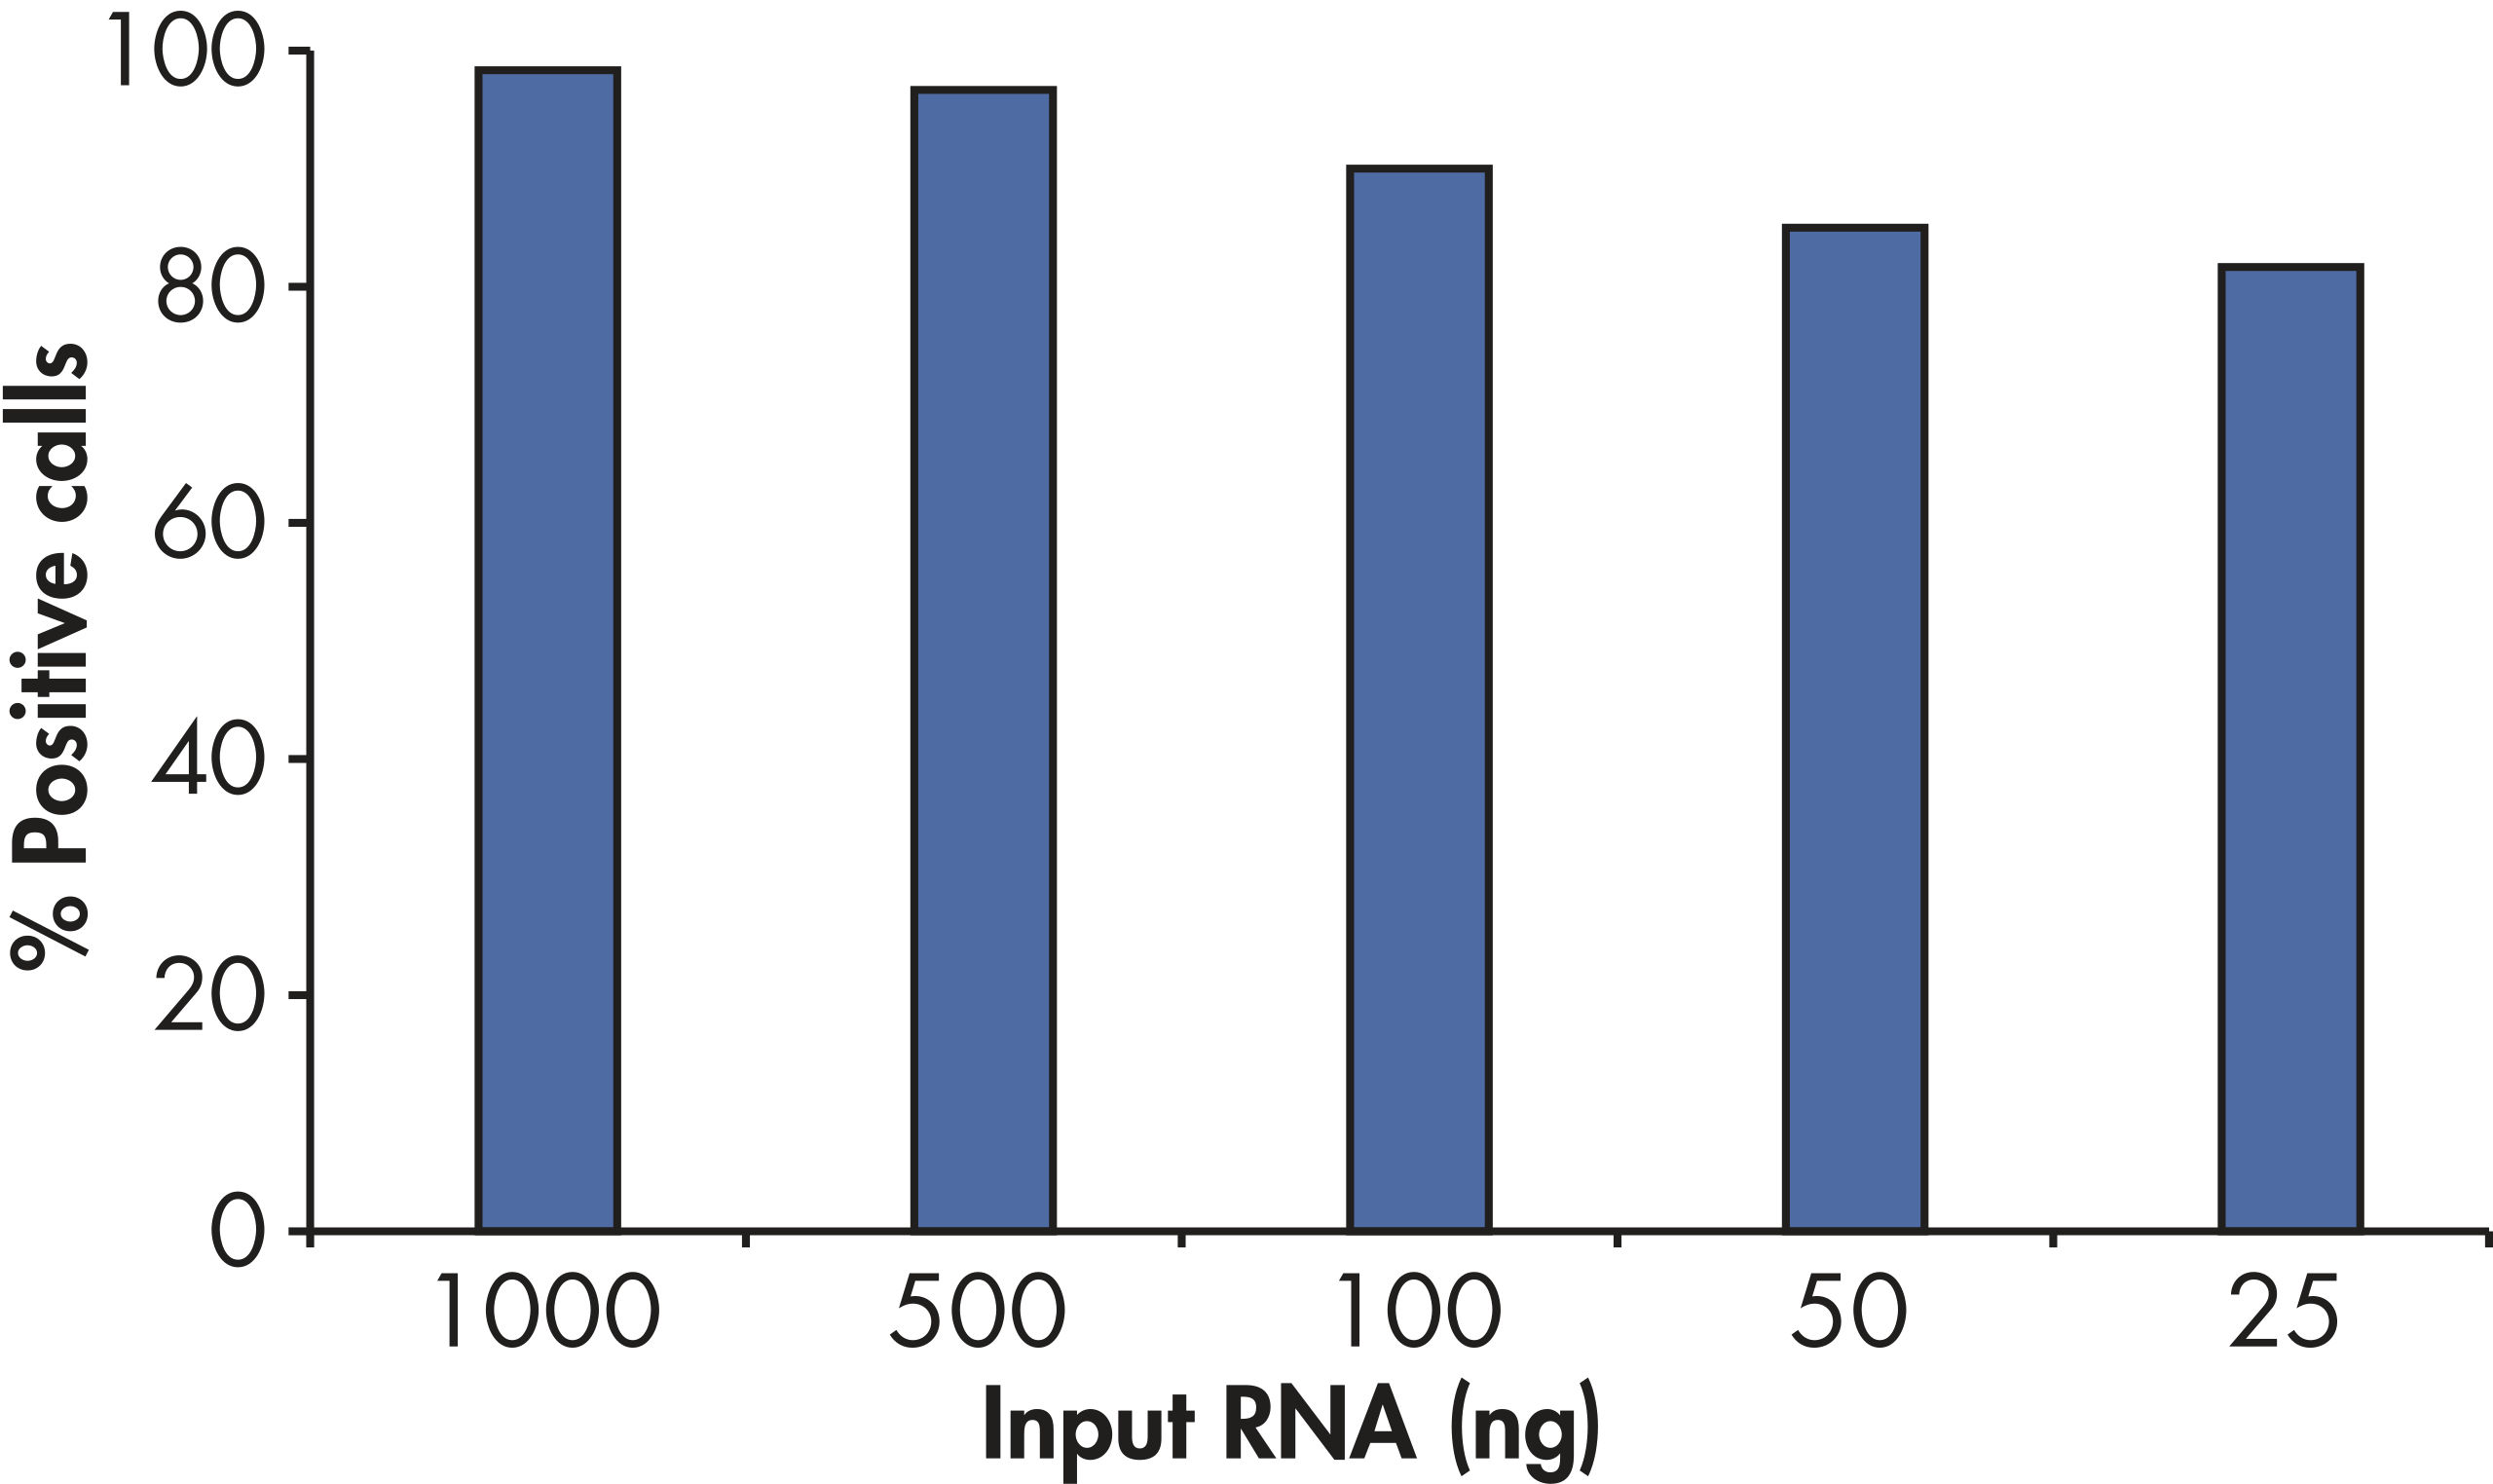
RT2 First Strand Kit灵敏度高,每个芯片使用至少1 ng或至多5 µg总RNA可获得高于80%的阳性信号率(参见" Positive results with as little as 25 ng RNA")。

重复性

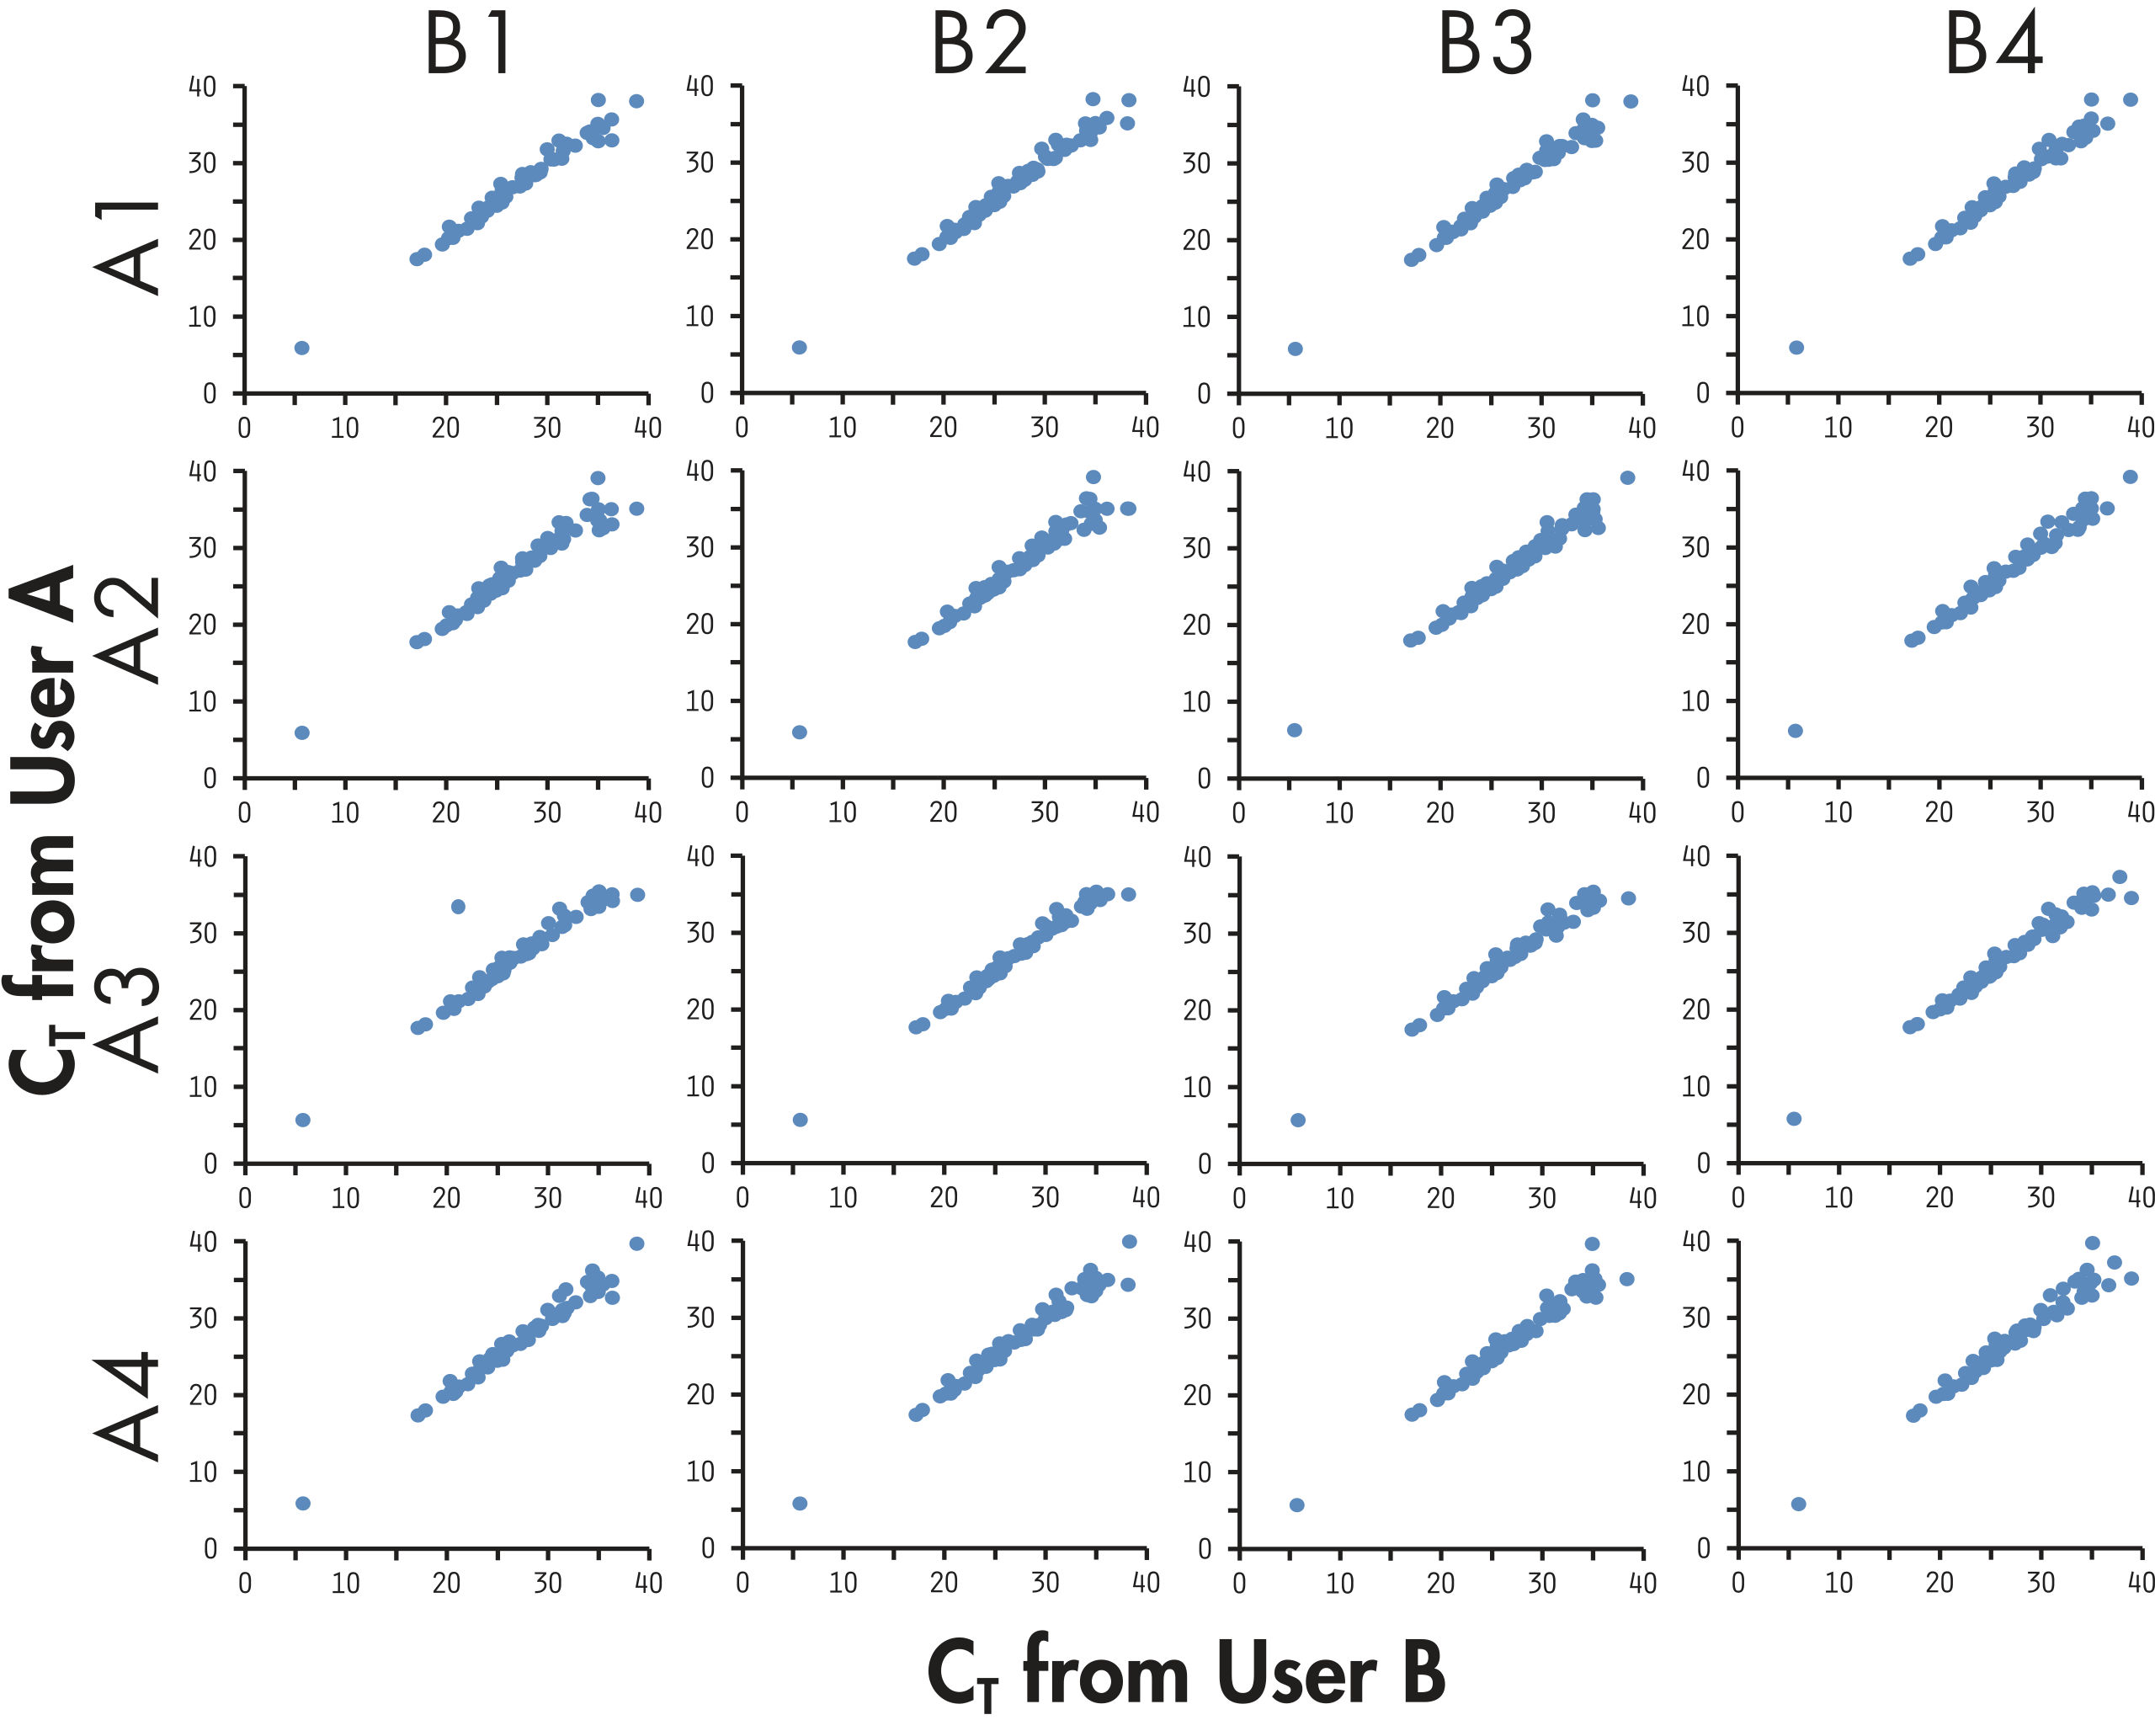
整个PCR芯片体系与技术上的重复性、批次和仪器有很高的相关性,平均相关系数>0.99,确保对生物样本间的表达差异进行可靠的检测(参见" High reproducibility among different users")。

特异性

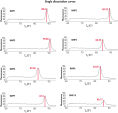
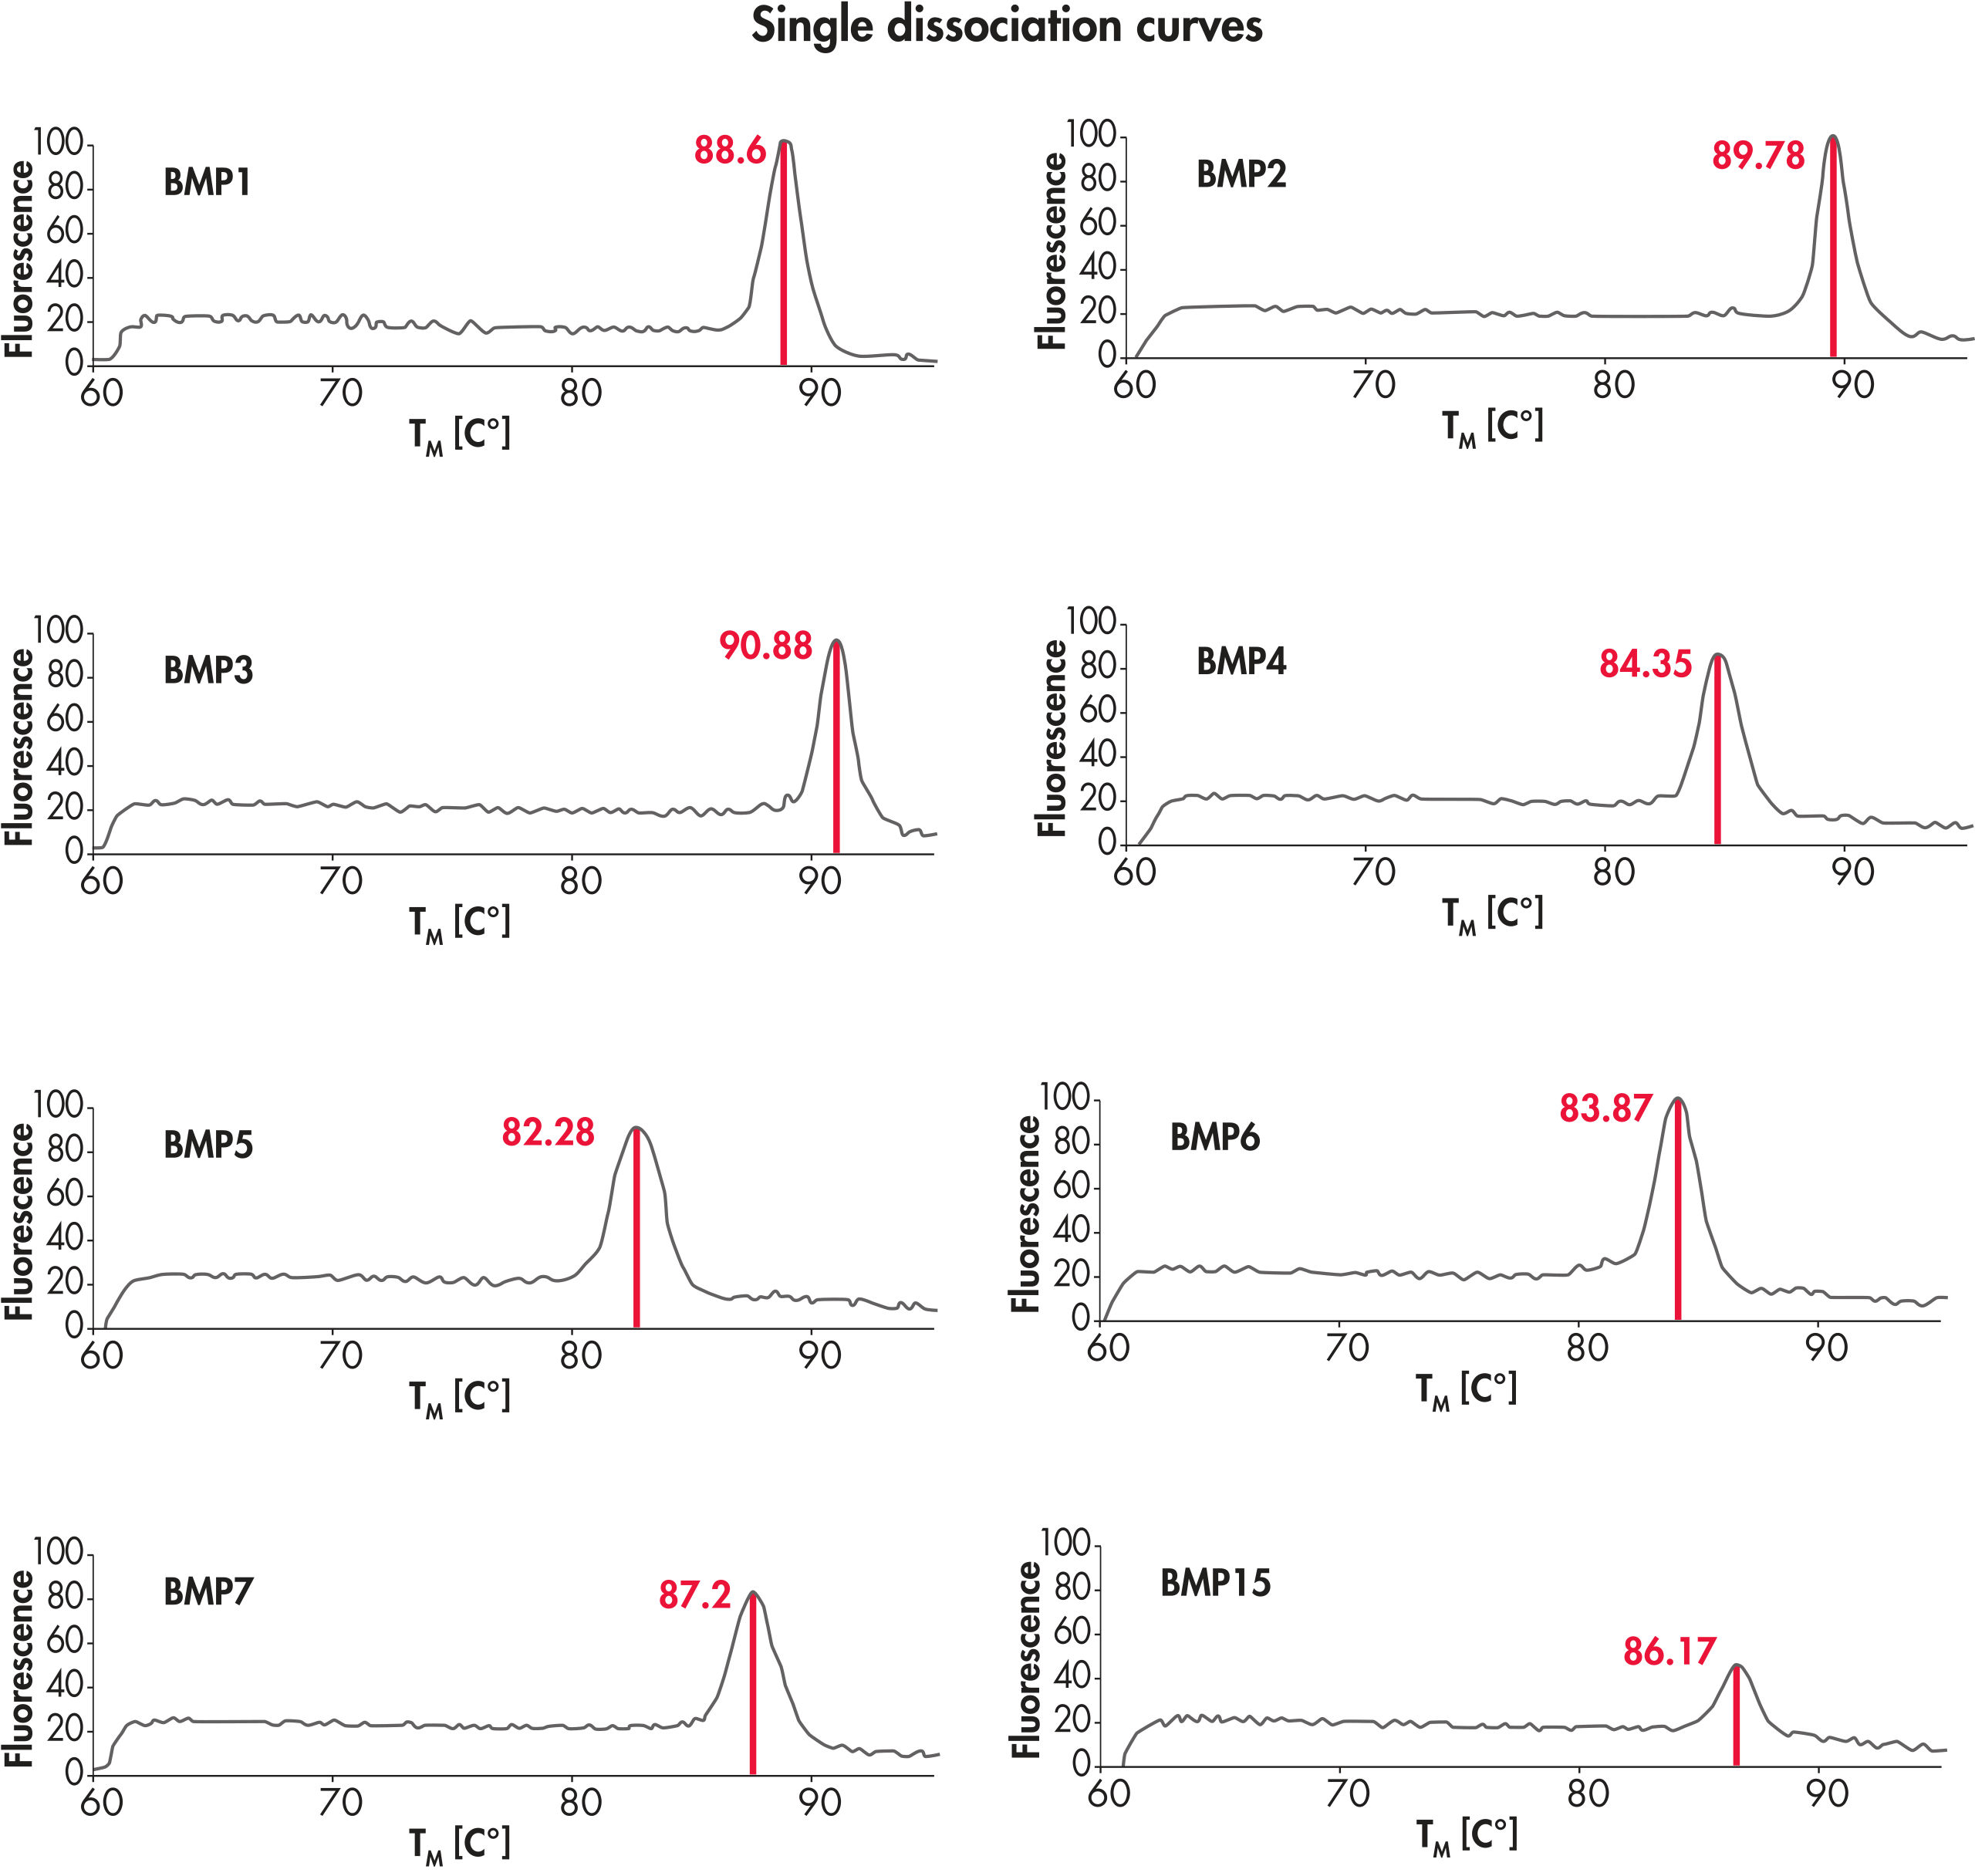
PCR芯片体系使用高品质RNA,可在预期位置形成单条带,无引物二聚体或其他二级产物,由此可获得高度准确的real-time PCR结果(参见" A single gene-specific product in every reaction")。

统一的PCR扩增效率

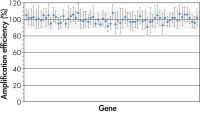
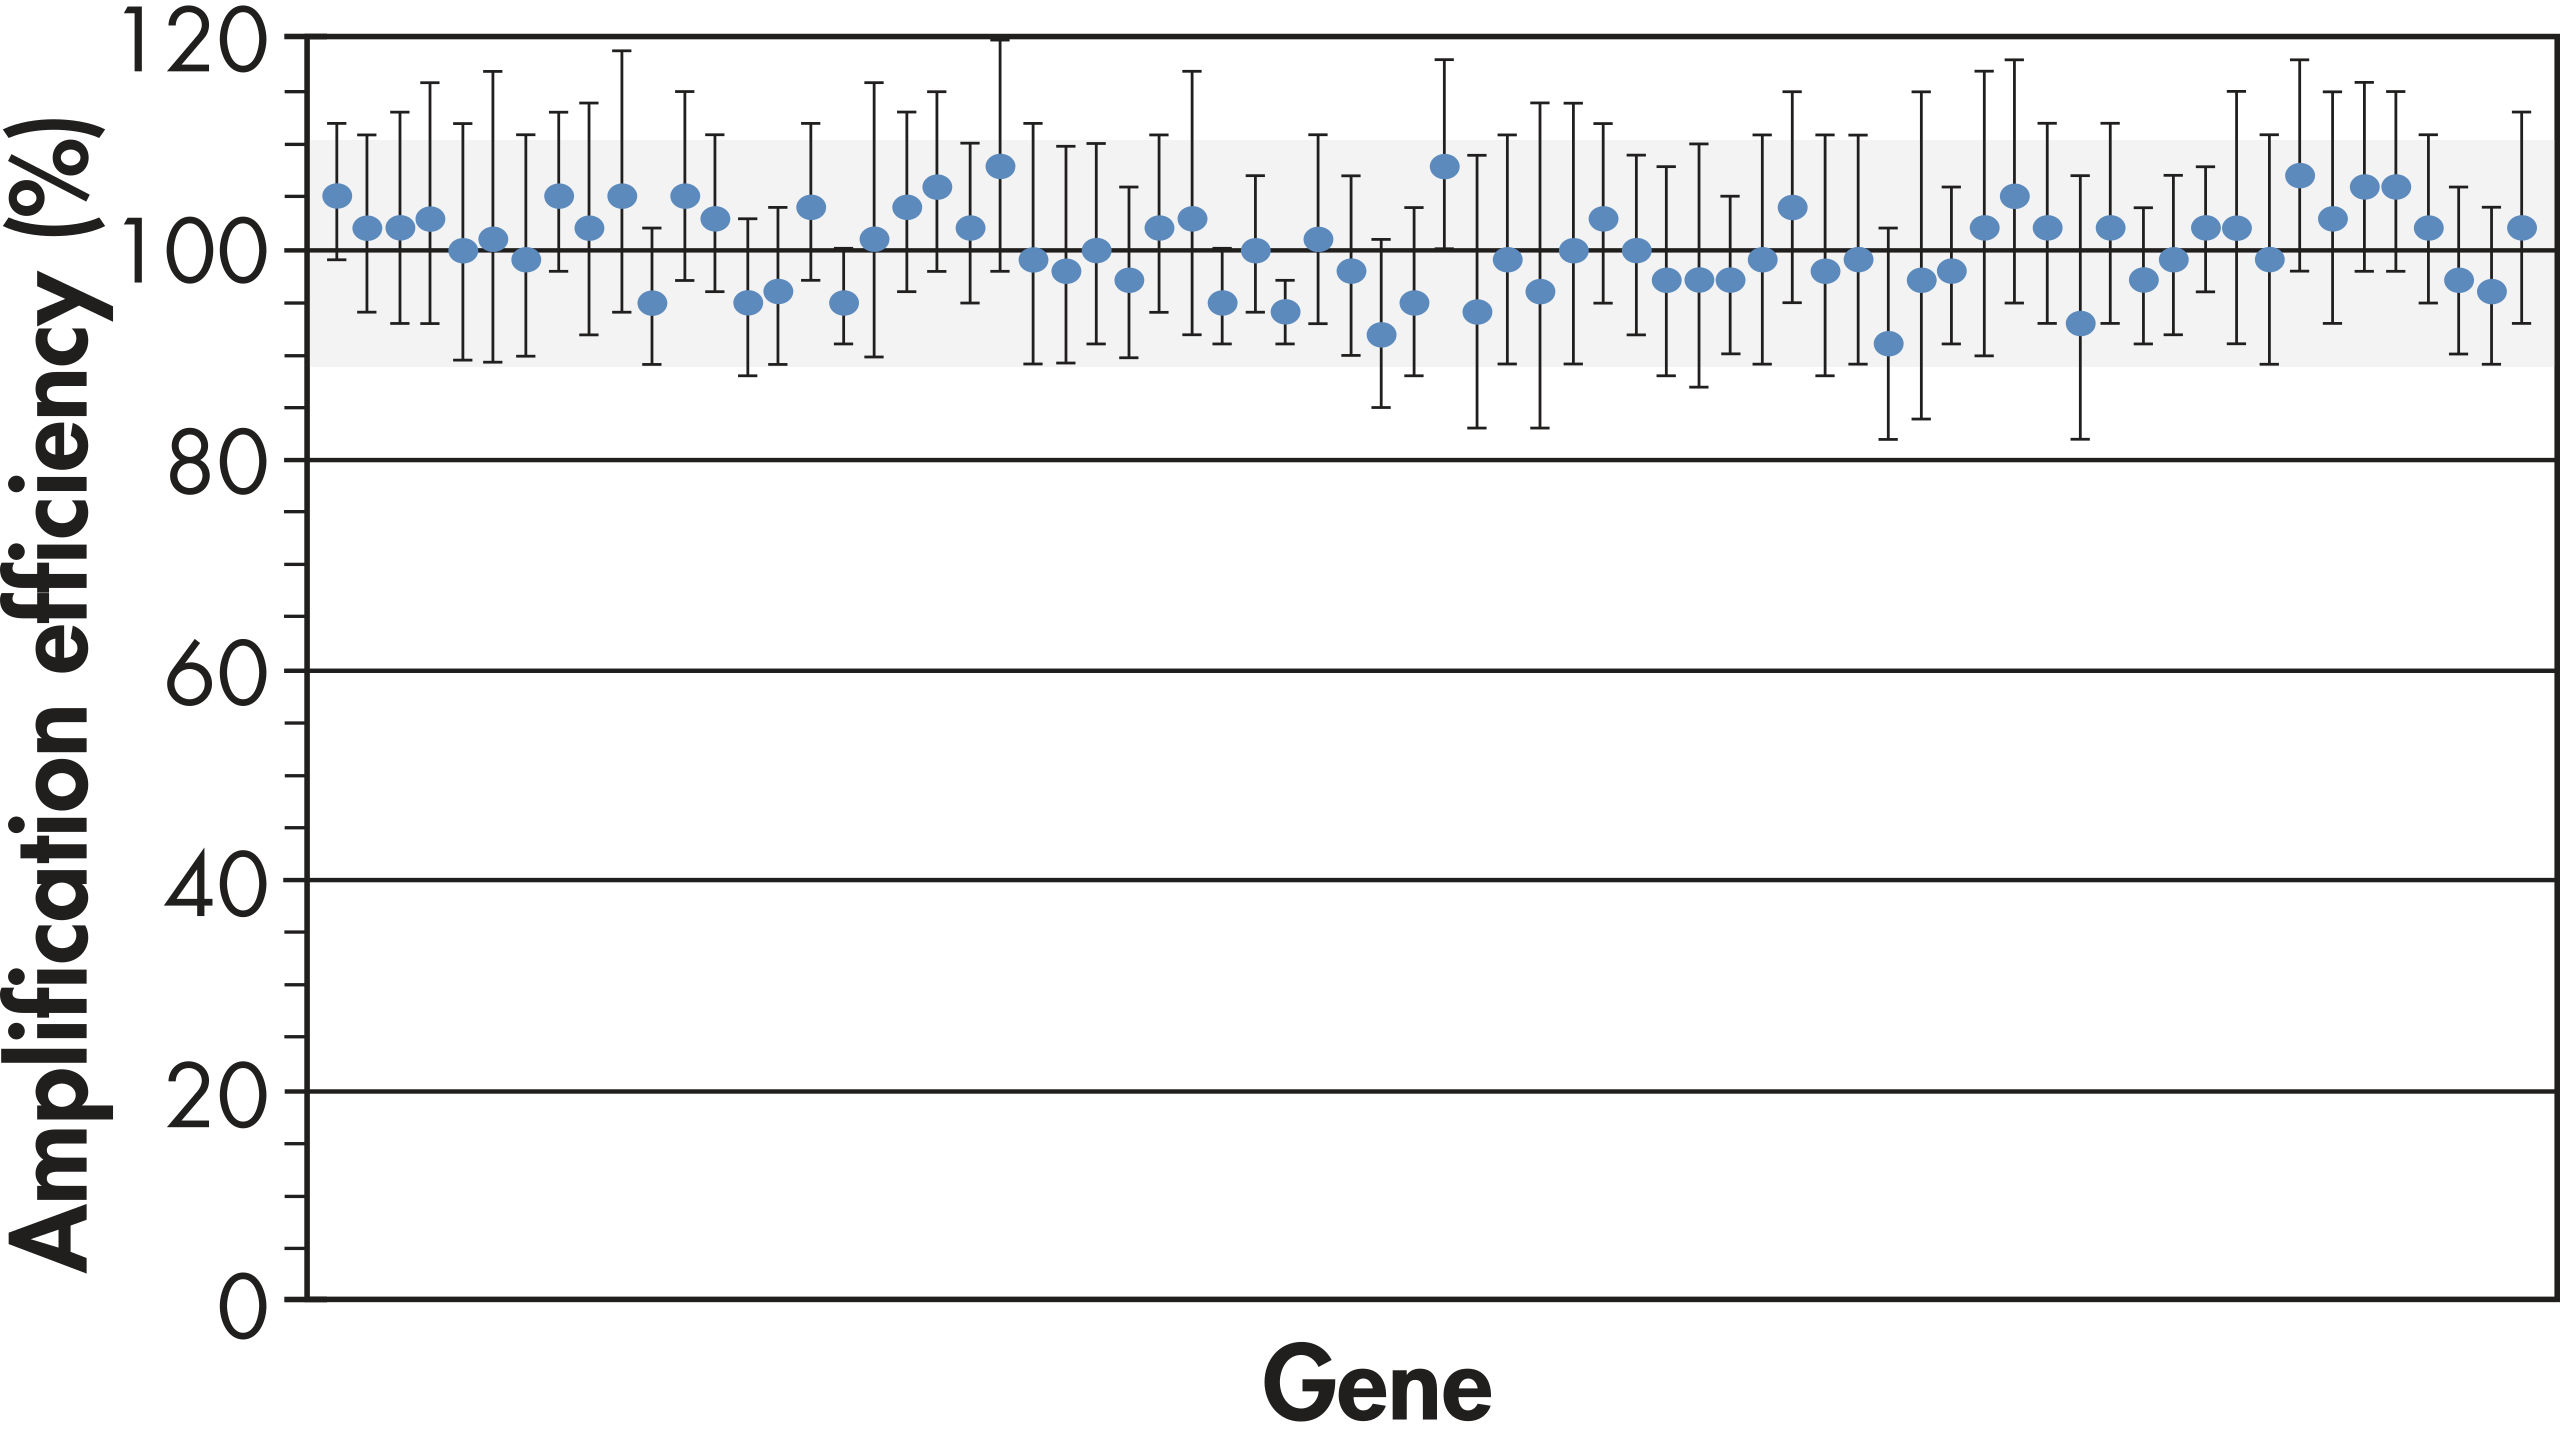
对多种样本的多个基因进行准确的基因表达比较,需要PCR芯片技术具有统一的PCR扩增效率。将专有的引物设计法则与严格的引物分析检测相结合,确保PCR芯片的每次引物分析都具有高性能(参见" PCR arrays yield highly accurate results")。


See figures

Principle

RT2 Profiler PCR Arrays是分析一组特定基因表达的可靠工具。每个96孔板、384孔板或100孔盘PCR芯片都包含SYBR® Green优化的引物分析,可对相关的通路或疾病相关的基因进行细致的研究。RT2 Profiler PCR Arrays也可针对您特定的研究兴趣对一些基因作定制化分析。高品质引物设计和RT2 SYBR® Green qPCR Mastermix规格使PCR芯片可在统一的循环条件下同时扩增96或384个不同的基因特异性产物。

这种整合使RT2 Profiler PCR Array具有高特异性和扩增效率,可获得准确的SYBR® Green real-time PCR结果。PCR芯片在任何研究实验室都易于使用。

RT2 Profiler PCR Arrays具有足够高的敏感度,可使用从常规样本(0.1–5 µg RNA)、FFPE样本和小样本(1–100 ng RNA)制备的RNA。

Procedure

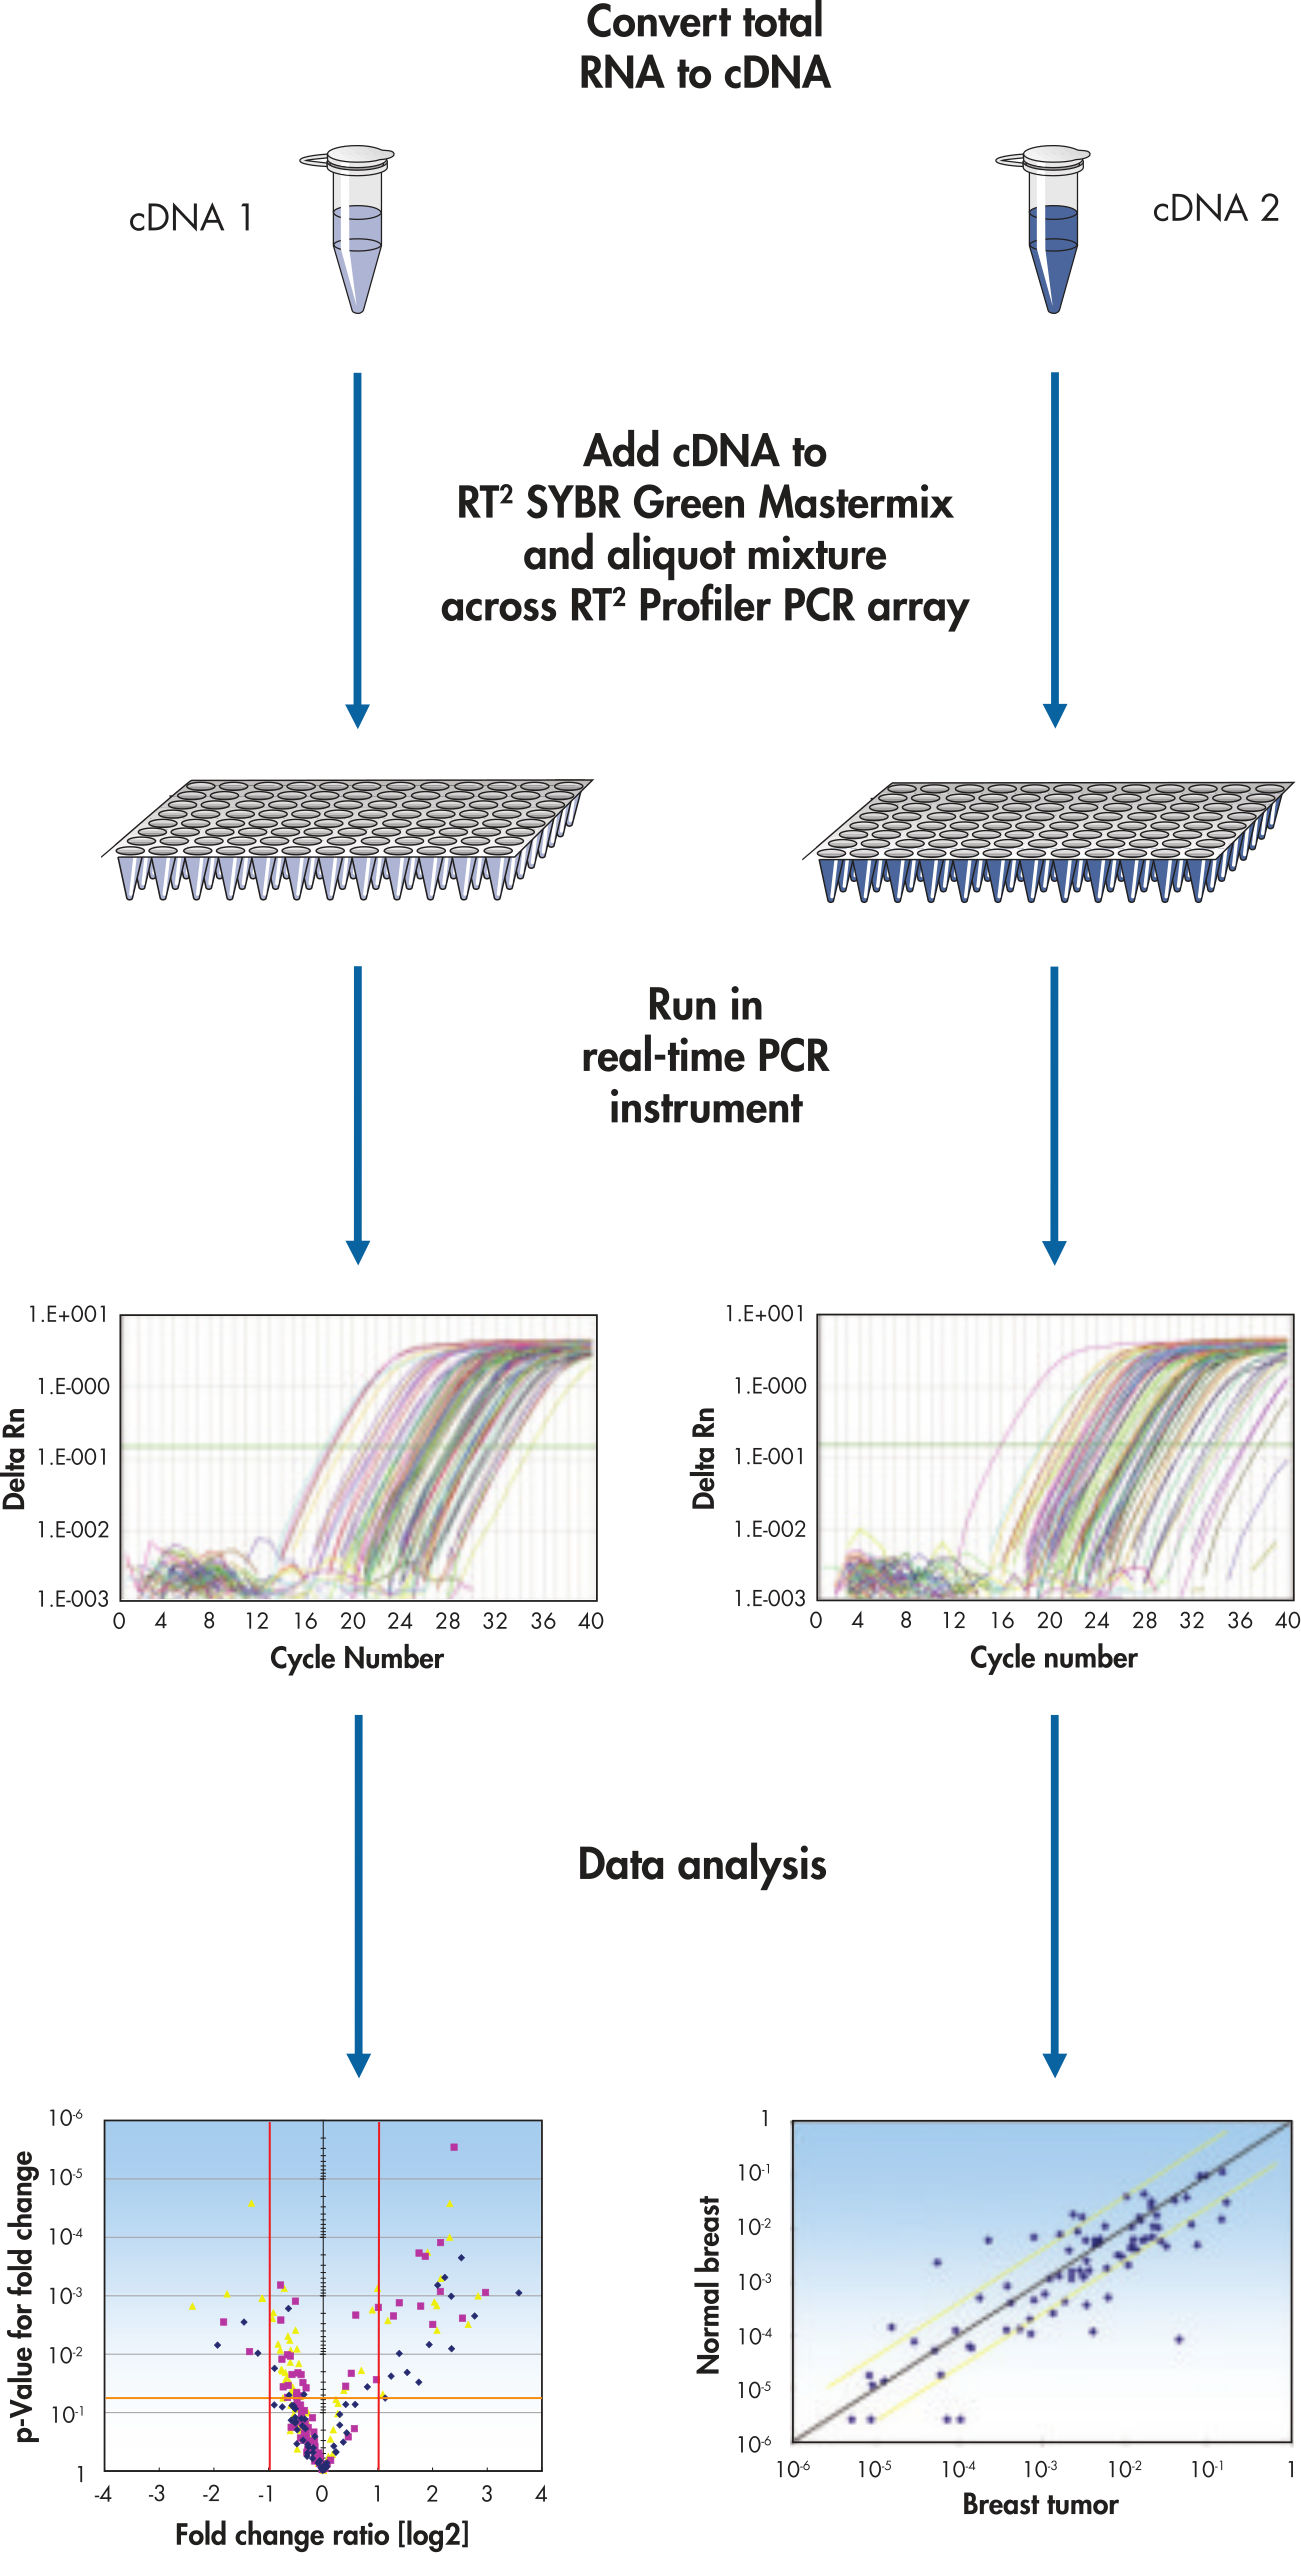
只需将cDNA模板与合适的即用型PCR预混液混合,等体积加入到同一个孔板的每个孔中,然后即可运行real-time PCR循环程序(参见" Simple procedure")。RT2 Profiler PCR Arrays可与所有QIAGEN、ABI、Bio-Rad、Eppendorf、Roche和Stratagene的仪器兼容。

灵活的布局和对照

RT2 Profiler PCR Arrays有96孔板、384孔板和100孔盘等规格,可检测84或370个与疾病或通路相关的基因,外加5个管家基因。每个RT2 Profiler PCR Array还包括以下对照因素:

  • 数据标准化
  • 基因组DNA污染检测
  • RNA样品质量 
  • 总体PCR性能
易用的数据分析

可使用易用的基于Excel的数据分析模板或基于网络的软件进行数据分析。数据分析基于ΔΔCT法,原始数据可对每个管家基因标准化。

See figures

Applications

RT2 PCR Profiler Arrays可用于生物学和医学研究的各个领域,包括:

  • 癌症研究
  • 炎症和细胞因子分析
  • 干细胞研究
  • 神经生物学
  • 信号转导通路研究
  • 细胞黏附和细胞迁移
  • 生物标记分子筛选和验证

Supporting data and figures

Resources

产品介绍与指南 (5)
安全数据表 (1)
Download Safety Data Sheets for QIAGEN product components.
下载文件 (3)
For analyzing gene expression data from RT2 Profiler PCR Arrays 
Data analysis file for RT² Profiler PCR Array Housekeeping Genes
Catalog number- 330231
Pathway number- PAXX-000
RNA QC Data Analysis
XLS (484KB)

Data analysis file for RT² ProfilerRT² Profiler™ PCR Array RT2 RNA QC
Catalog number- 330231
Pathway number- PAXX-999

学术海报 (1)
Poster for download
试剂盒操作手册 (1)
For pathway-focused gene expression profiling using real-time RT-PCR
仪器技术参数 (2)
For gene expression and genomic analysis
For pathway-focused gene expression analysis
Certificates of Analysis (1)
Brochures & Guides (5)
Download Files (3)
Data analysis file for RT² Profiler PCR Array Housekeeping Genes
Catalog number- 330231
Pathway number- PAXX-000
RNA QC Data Analysis
XLS (484KB)

Data analysis file for RT² ProfilerRT² Profiler™ PCR Array RT2 RNA QC
Catalog number- 330231
Pathway number- PAXX-999

For analyzing gene expression data from RT2 Profiler PCR Arrays 
Kit Handbooks (1)
For pathway-focused gene expression profiling using real-time RT-PCR
Instrument Technical Documents (2)
For pathway-focused gene expression analysis
For gene expression and genomic analysis
Scientific Posters (1)
Poster for download

Publications

CD8 T cells use IFN-γ to protect against the lethal effects of a respiratory poxvirus infection.
Goulding J; Abboud G; Tahiliani V; Desai P; Hutchinson TE; Salek-Ardakani S;
J Immunol; 2014; 192 (11):5415-25 2014 Apr 18 PMID:24748494
Sphingosine kinase 1 expressed by endothelial colony-forming cells has a critical role in their revascularization activity.
Poitevin S; Cussac D; Leroyer AS; Albinet V; Sarlon-Bartoli G; Guillet B; Hubert L; Andrieu-Abadie N; Couderc B; Parini A; Dignat-George F; Sabatier F;
Cardiovasc Res; 2014; 103 (1):121-30 2014 Apr 17 PMID:24743591
Adipose tissue insulin resistance due to loss of PI3K p110α leads to decreased energy expenditure and obesity.
Nelson VL; Jiang YP; Dickman KG; Ballou LM; Lin RZ;
Am J Physiol Endocrinol Metab; 2014; 306 (10):E1205-16 2014 Apr 1 PMID:24691033
FBXW7 mutations in melanoma and a new therapeutic paradigm.
Aydin IT; Melamed RD; Adams SJ; Castillo-Martin M; Demir A; Bryk D; Brunner G; Cordon-Cardo C; Osman I; Rabadan R; Celebi JT;
J Natl Cancer Inst; 2014; 106 (6):dju107 2014 May 16 PMID:24838835
β-Carotene-9',10'-oxygenase status modulates the impact of dietary tomato and lycopene on hepatic nuclear receptor-, stress-, and metabolism-related gene expression in mice.
Tan HL; Moran NE; Cichon MJ; Riedl KM; Schwartz SJ; Erdman JW Jr; Pearl DK; Thomas-Ahner JM; Clinton SK;
J Nutr; 2014; 144 (4):431-9 2014 Feb 19 PMID:24553694

FAQ

What is the best approach for determining where to set the CT threshold when you have >15 samples? Is it best to go through all of them, looking for a range of best fit, and then just choose one value that fits all of them?
The best way to set the threshold is to make sure that your PPC values are between 18 and 22. I would look my first PCR Array, set it so that the PPC is at 20, and see if the same threshold fits for the rest of the arrays.
FAQ ID -2705
How many housekeeping genes are included in each PCR Array?
Each PCR Array has 5 housekeeping genes. You can use one or an average of the most stable ones to do data analysis.
FAQ ID -2704
Are primers available that only detect mitochondrial DNA encoded genes and not nuclear genomic DNA encoded genes?
There are less than a dozen genes encoded by the mitochondrial genome (all other mitochondrial proteins are encoded by nuclear genes), and they are all transcribed as one transcript (just like any prokaryote), so distinguishing the expression of individual genes by real-time RT-PCR is not possible.
FAQ ID -2680
What is the RT² Profiler PCR Array?
The RT² Profiler PCR Array is a 96-/384-well plate or 100-well disc that contains gene-specific Primer Assays for a thoroughly researched set of relevant, pathway- or disease-focused genes. It simultaneously profiles the expression of 84 pathway-specific genes, and five housekeeping genes. Each RT² Profiler PCR Array also includes a Genomic DNA Control (GDC) assay, triplicate Reverse Transcription Controls (RTC), and triplicate Positive PCR Controls (PPC).
FAQ ID -2718
What are the guidelines for choosing a housekeeping gene for normalizing qPCR results?

If you are unsure of the correct housekeeping gene(s), review the literature and technical information in your field to determine which gene(s) other researchers commonly use. It is recommended that multiple housekeeping genes be utilized for each gene expression experiment, to account for any impact that an experimental condition may have on the expression of an individual housekeeping gene. For a systematic assessment of which housekeeping genes are appropriate for your specific experimental conditions, we recommend using the Housekeeping Genes RT2 Profiler PCR Arrays for human (330231 PAHS-000), mouse (330231 PAMM-000), or rat (330231 PARN-000). These arrays consist of 8 sets of 12 common housekeeping genes. They are a valuable tool for easily identifying genes with a constant level of expression among your different experimental conditions.

FAQ ID -2674
How can I ensure that reaction volume is not lost due to evaporation during thermal cycling?
Be sure to carefully and completely seal the qPCR assay plate with fresh, optical, thin-wall, 8-cap strips or adhesive optical film before the plate is placed into the real-time cycler. In addition, refer to your instrument's user's manual to determine whether the real-time cycler manufacturer recommends use of a plate compression pad during the run.
FAQ ID -2679
Do you always run samples in triplicates?
No. Data Analysis can be done with a little as 2 PCR Arrays. Whether or not you run a sample in triplicate is determined by experimental setup and what you are going to use the data for.
FAQ ID -2703
Is it good to pool multiple RNA replicates to detect expression changes that are consistently reproducible?
With the additional RT2 PreAMP methodology, only 1 ng of RNA is now needed for PCR Array analysis. Pooling RNA from different sources should only be done when there is not enough sample. We recommend running biological replicates.
FAQ ID -2663
How do I create a workspace that is free of DNA contamination, prior to carrying out a qPCR experiment?

Any DNA contamination will artificially inflate the SYBR Green signal, yielding skewed gene expression profiles and false-positive signals. The most common source of DNA contamination is from PCR products generated during previous experiments. Such contamination is most often due to the improper disposal of tubes, tips, and gels that previously came into contact with PCR products. Additionally, PCR products may also contaminate pipettors, racks, work pads, and commonly used reagents such as water and buffers. To minimize the risk of contaminating your experiment with extraneous DNA, the following steps should be taken:


  • Remove a single aliquot of water from your PCR-grade stock, sufficient to complete the experiment. This minimizes the number of times that the stock container is opened, thereby minimizing contamination risks.
  • Use only fresh PCR-grade reagents and disposable labware.
  • Treat any labware (tubes, tips, and tip boxes) used in PCR with 10% bleach, before discarding.
  • Maintain a dedicated workspace for PCR setup (perhaps a PCR-only hood), away from areas of the lab where post-PCR work is done, such as running gels, enzyme digestions, and cloning.
  • Change the lab bench pads/papers often and decontaminate lab benches and labware (racks, pipettors, etc.) before each use by washing with 10% bleach, and/or exposing to UV light for at least 10 minutes. This serves to degrade and/or inactivate contaminating DNA.
  • Before, during, and after the experiment, minimize the opening and closing of any tubes or plates used during the experiment.  
FAQ ID -2654
On which instrumentation will the RT² Profiler PCR Array work?

For real-time detection, the RT² Profiler PCR Array is currently available for most QIAGEN, ABI, BioRad, Eppendorf, Stratagene, TaKaRa, Fluidigm, Cepheid, and Roche real-time instruments. Please refer to the link below, to determine which RT² Profiler PCR Array plate format is compatible with your instrument.

http://www.sabiosciences.com/manuals/PCRArrayGuide.pdf


FAQ ID -2719
What negative controls are typically included in qPCR and/or qRT-PCR experiments?

The 3 most common negative controls included in a qPCR and/or qRT-PCR experiment are as follows:

1. A no template control (NTC) omits any DNA or RNA template from a reaction, and serves as a general control for extraneous nucleic acid contamination. When using SYBR Green chemistry, this also serves as an important control for primer dimer formation. Within the RT2 Profiler PCR Arrays, the GDC well also serves as a no template control, as this assay is designed to detect Genomic DNA.

2. A no reverse transcriptase control (NRT) or minus reverse transcriptase control (MRT) involves carrying out the reverse transcription step of a qRT-PCR experiment in the absence of reverse transcriptase. This control assesses the amount of DNA contamination present in an RNA preparation.

3. A no amplification control (NAC) omits the DNA polymerase from the PCR reaction. This is a control for background fluorescence that is not a function of the PCR. Such fluorescence is typically attributable to the use of a degraded, dual-labeled probe. This control is unnecessary when utilizing SYBR-Green probe chemistries.

FAQ ID -2672
Do I need to run a standard curve before the actual PCR array experiment?
There is no need to run a standard curve before doing the RT2 PCR Array experiment. Usually we recommend starting with 1000 ng total RNA for a 96-well PCR array.
FAQ ID -2664
What are the most reliable methods for preparing high-quality RNA from cell or tissue samples, for use in gene expression analysis experiments?
We recommend the use of RNeasy Mini Kits. Cultured cells, and freshly isolated white blood cells, may be harvested by centrifugation, and used directly with this kit. For the isolation of high-quality RNA from animal tissues, we recommend RNeasy Plus Universal Kit.
FAQ ID -2657
What are the main differences between the qBiomarker PCR Arrays and the RT2 Profiler PCR Arrays?
The qBiomarker PCR Arrays contain gene lists that have been biologically validated and selected to measure the expression of a limited number of genes that are highly predictive for a biological process. Each qBiomarker PCR Array is designed to analyze multiple samples on the same 96-well or 384-well PCR plate. These arrays are best suited for screening and validation applications for a specific biological process. In contrast, the RT2 Profiler PCR Arrays typically have 84 pathway focused genes which are selected based on a different bioinformatic process and are best suited for gene expression profiling applications where a relative fold change result, and not a predictive answer, is necessary.
FAQ ID -2438
How can I predict the percent qPCR signal due to contaminating DNA, for a given qPCR assay, and its matching NRT control?

Assuming 100% amplification efficiency, each step increase in Ct value represents a doubling in the amount of qPCR template. Therefore, evaluating the difference in Ct values between the qPCR assay, and its matching NRT control, leads to the following predictions:

CtNRT - Ct+RT Fraction of gene expression signal due to contaminating DNA Percentage of gene expression signal due to contaminating DNA
1 (1/21) = 1/2 50%
2 (1/22) = 1/4 25%
3 (1/23) = 1/8 13%
4 (1/24) = 1/16 6%
5 (1/25) = 1/32 3%

FAQ ID -2688
How can I determine whether amplification occurs from mRNA-derived cDNA or from genomic DNA contamination?
The most rigorous method to detect genomic DNA contamination, particularly with the RT² qPCR Primer Assays, is to perform a No Reverse Transcriptase (NRT) control. The PCR will have no cDNA template derived from mRNA, and any detectable product could only have been derived from genomic DNA contamination.
FAQ ID -2687
Why are my qPCR Ct values too low (< 12) in my qRT-PCR Assay?
You may be using too much template. Use less input total RNA for reverse transcription, or use template at a greater dilution factor (lower concentration). Do not pipet a volume of less than 1 μl.
FAQ ID -2684
What is a dissociation curve, and why is it important to run a dissociation curve, following qPCR using SYBR Green chemistry?

Dissociation curves are carried out at the end of a PCR experiment by following a 3-step procedure.

First, all the components are denatured at 95°C, followed by complete annealing at a set temperature (based on the primer Tm values), followed by a gradual increase in temperature up to 95°C. Fluorescence intensity is monitored during this final temperature increase, resulting in the generation of a melting curve or dissociation curve.

By analyzing the first derivative of such a curve, you can readily assess the homogeneity of the PCR products, including the presence of primer–dimers, thereby determining the specificity of the PCR reaction. It is important to carry out such post-PCR analyses when using SYBR Green probe chemistry due to this reagent's lack of sequence specificity.

FAQ ID -2678
What positive controls are typically included in qPCR and/or qRT-PCR experiments?

It is critical to include appropriate positive controls in a qPCR experiment to determine if false negatives are being detected in the experiment. Positive controls fall into one of 2 classes.

1. Exogenous positive controls refer to the use of external DNA or RNA carrying a target of interest. If these positive controls are assayed in separate wells/tubes from the experimental sample, they serve as a control to determine whether or not the reverse transcription and/or PCR reaction conditions are optimal. Additionally, exogenous DNA or RNA positive controls may be spiked into the experimental sample(s), and assayed in parallel or in a multiplex format with, the target of interest. These control reactions assess whether the samples contain any components that inhibit reverse transcription and/or PCR.

2. Endogenous positive controls refer to the use of a native target that is present in the experimental sample(s) of interest, but is different from the target under study. These types of controls are often referred to as normalizers, and are typically used to correct for quantity and quality differences between samples.

Within the RT2 Profiler PCR Arrays, the Positive PCR Control (PPC) wells contain a plasmid with a primer assay that detects a sequence it produces. This allows for quick confirmation of the performance of the PCR steps.

The RTC wells include assays that detect the artificial RNA that is spiked in to each sample during the cDNA synthesis step. This ensures the Reverse Transcription step proceeded as needed.

FAQ ID -2673
Will the Reverse transcription control on the RT2 profiler PCR array work on any cDNA library?

The Reverse transcription control requires that the reverse transcription is done with the RT2 first strand kit. No other cDNA synthesis method can use this control. 

FAQ ID - 3534
Why is 18S ribosomal RNA (rRNA) used as a housekeeping gene to normalize sample-to-sample, systematic variation in qPCR assays?
18S ribosomal RNA is a widely used control for qRT-PCR analyses because of its invariant expression across tissues, cells, and experimental treatments. However, due to its extremely high expression in most cell types, it can sometimes be challenging to use 18S rRNA as an endogenous normalizer for several gene expression assays in the same reaction.
FAQ ID -2675
Can I manually set the threshold line?
You can manually set the threshold line. If you are using a catalogued PCR Array, the PPC values should be 20 +/- 2 Cts. Use the same threshold on all of your PCR Arrays.
FAQ ID -2702
What is the delta Rn value?
The Rn value, or normalized reporter value, is the fluorescent signal from SYBR Green normalized to (divided by) the signal of the passive reference dye for a given reaction. The delta Rn value is the Rn value of an experimental reaction minus the Rn value of the baseline signal generated by the instrument. This parameter reliably calculates the magnitude of the specific signal generated from a given set of PCR conditions. For more information, please refer to your cycler's user manual.
FAQ ID -2681
How do you determine the efficiency using the PCR array?
We determine the amplification efficiency during wet bench testing of our assays using standard curve dilutions, or by single curve analysis. If you would like to calculate the efficiency of each curve using single curve analysis, then you can try Real-Time PCR Miner, LinReg or Dart PCR. Each of these can be found using a GOOGLE search.
FAQ ID -2701
May I try the data analysis tool without using your PCR array kit?
Yes, all you need to do is to organize your data into a “custom PCR Array” file. When you upload it to the website, use the custom PCR array name CUSTOM. The locations of the blank excel spreadsheet is: http://www.sabiosciences.com/pcrarraydataanalysis.php#custom
FAQ ID -2698