Rotor-Gene ScreenClust HRM Software

用于高效的高分辨率熔解分析

S_1202_IAS_RGQ_0083_s

✓ 24/7 automatic processing of online orders

✓ Knowledgeable and professional Product & Technical Support

✓ Fast and reliable (re)-ordering

Rotor-Gene ScreenClust HRM Software

Cat. No. / ID:  9020147

Software CD, user guide
Copy order details
Log in To see your account pricing.
Rotor-Gene ScreenClust HRM Software 旨在用于分子生物学应用。该产品不能用于疾病诊断、预防和治疗。

✓ 24/7 automatic processing of online orders

✓ Knowledgeable and professional Product & Technical Support

✓ Fast and reliable (re)-ordering

Features

  • 创新的数学方法进行HRM分析
  • supervised模式进行高度精确的基因型鉴定
  • unsupervised模式自动检测新突变
  • 统计学方法分类并分析HRM数据
  • 最少的人工,流程标准化的数据分析

Product Details

Rotor-Gene ScreenClust HRM Software是一款功能强大的高分辨率熔解(HRM)数据分析工具,可分析Rotor-Gene Q实时荧光定量PCR分析仪或Rotor-Gene 6000分析仪的数据。Rotor-Gene ScreenClust HRM Software通过将样品进行分组,用于诸如基因分型和突变扫描等应用。

Performance

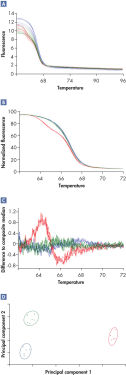
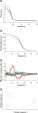
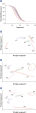
Rotor-Gene Q实时荧光定量PCR分析仪与Rotor-Gene ScreenClust HRM Software联用甚至可鉴定高难度的class IV A/T SNP,这些序列熔解温度的差异可能小至0.1°C(参见"I dentification of a class IV SNP")。

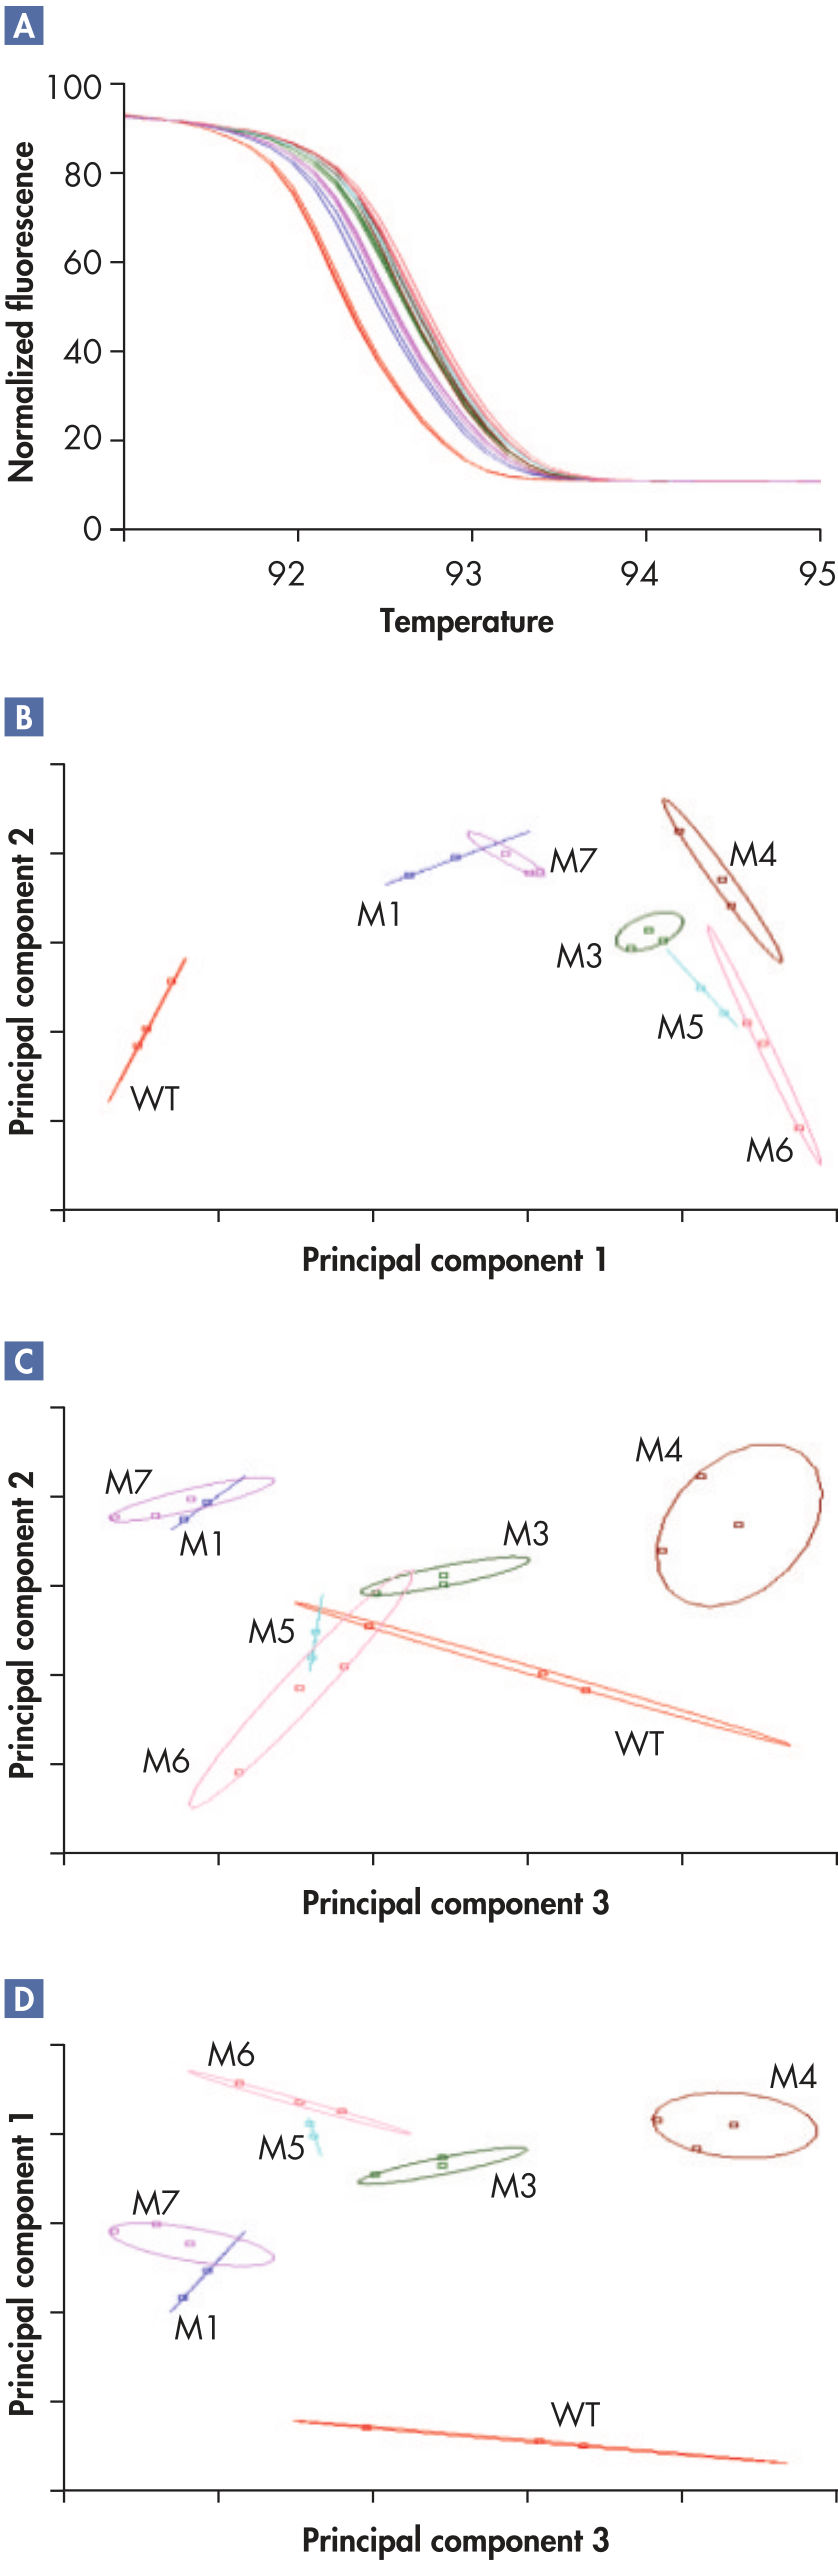
在基因突变检测实验中,对EGFR基因外显子19中由基因插入或缺失引起的突变进行分析(参见" Successful mutation detection")。Rotor-Gene ScreenClust HRM Software 将数据分为前3个主要成分,精确地分离了多个相近且部分覆盖的熔解概况,对6个假定未知及野生型样品均进行了正确的区分。

See figures

Principle

HRM是一种创新的技术,基于双链PCR产物随着温度的升高从双链裂解为单链的熔解过程的行为差异,对其进行鉴定。首先通过PCR 扩增靶序列。然后通过高度精确的PCR产物熔解,根据序列、长度、GC含量或链互补性对样本进行区分,可检测到单碱基对的变化。事先无需知道序列信息,即可以直接简单的方式检测未知的甚至是复杂的序列变化。

可靠的HRM分析需要合适的HRM仪器、化学试剂和数据分析软件。Rotor-Gene Q实时荧光定量PCR分析仪独特的转子设计使其具备卓越的热学和光学表现,是HRM分析的理想仪器。Type-it HRM PCR Kit提供经优化的化学试剂,进行精确的序列变化分辨以及明确的等位基因检测。

HRM数据分析通过对比不同样品熔解曲线的位置和形状鉴定基因型。杂合子和纯合子的熔解曲线的形状和熔解点(Tm)是不同的。在标准的HRM软件包中,对比待测样品与对照样品的熔解曲线的形状和位置以区分不同样品。这个方法有可能会获得不可靠的、难以分析的结果,同时可能需要耗时的人工分析。相反地,Rotor-Gene ScreenClust HRM Software应用创新的数学运算法则鉴定样品,并对其进行分类。

Procedure

Rotor-Gene ScreenClust HRM Software通过下列4步分析数据:

  • 标准化 
  • 生成残差图
  • 主要成分分析
  • 聚类

该软件为用户提供全程指导,给出每一步可做的相关选择的信息。

在Rotor-Gene热循环仪上进行的HRM实验生成的原始数据(*.rex 文档)可使用Rotor-Gene ScreenClust HRM Software进一步分析。在分析的第一步,将曲线缩放到最适合的一条线上,使最高荧光值相当于100,最低的相当于0,从而实现数据标准化。然后分化曲线,通过所有样品的中间荧光值获得一条成分中线。从这个成分中线中减去每个样品的熔解轨迹,绘出残差图。分析残差图,抽提出主要成分,对单个样品进行鉴定。主要成分分析是一种广泛使用的数据分析方法,而Rotor-Gene ScreenClust HRM Software是第一款对HRM数据进行主要成分分析的应用软件。主要成分分析强调数据中的相似点和不同点,以supervised或unsupervised模式生成聚类图。

Rotor-Gene ScreenClust HRM Software根据等位基因对数据进行聚类(分组)。supervised模式通常用于基因类型已知的SNP基因分型,在该模式中,用户对每个聚类设定一个或多个对照样品,软件根据样品的特性对其进行聚类(自动调用)。unsupervised模式用于发现数据中的新突变,此时样品的基因类型是未知的或者是部分已知。在unsupervised模式中,该软件计算聚类的最佳数目。此功能是发现新多态性的理想工具。

两种模式的分析都显示为一个易于理解的聚类图,结果还提供统计学概率和典型性数据,以方便地对比不同实验的结果。所有数据和图片可方便地以各种格式导出,如JPG、PDF、CSV或XLS文档,并且可总结到一个实验报告中。

Applications

应用Rotor-Gene ScreenClust HRM Software进行HRM分析,为多种应用提供了巨大的潜力。SNP基因分型、突变扫描或检测实验可最大程度地受益于这项功能强大的技术。

Supporting data and figures

Resources

产品介绍与指南 (1)
Second edition — innovative tools
用户使用手册 (1)
Safety Data Sheets (1)
Certificates of Analysis (1)
Brochures & Guides (1)
Second edition — innovative tools
Technical Information (1)
Instrument User Manuals (1)

FAQ

What is the difference between probability and typicality in the Rotor-Gene ScreenClust HRM Software?

'Probability' is the likelihood or chance that a sample is a member of each available cluster. The combined probabilities of a single sample add up to 1.00.

'Typicality' in the Rotor-Gene ScreenClust HRM analysis is a measure of how well a sample fits into its assigned cluster. It can also be seen as a measure of how far away a sample is from the centre of the cluster. Typicality values range from 0 to 1, the higher the value the closer it is to the centre of its assigned cluster. If a sample has a typicality value of 0.5, it means that approximately half of all samples within that cluster will be closer to the centre and the other half will be further away. In reality, this might not be the case as small samples numbers can have skewed distributions.


FAQ ID -2203
Why are some of my samples outside of the cluster using Rotor-Gene ScreenClust HRM Software?

Clusters in Rotor-Gene ScreenClust HRM Software are graphically represented by ellipses/ellipsoids which act as a visual aid. They are not designed to cover all of the samples. They are a good tool for compare differences between clusters. To judge how well individual samples fit within their clusters use the typicality scores.


FAQ ID -2204
Why are most of my samples outside of the cluster in supervised mode using Rotor-Gene ScreenClust HRM Software?

The controls define the centre of the clusters in supervised mode using Rotor-Gene ScreenClust HRM Software. If the control samples lie on the fringe of the cluster then the cluster centre can be shifted away from the bulk of the samples within the cluster. Controls should provide a good representation of the expected behavior of unknown samples. If this is not the case the experimental setup should be re-evaluated.


FAQ ID -2205
Why do I need normalization using Rotor-Gene ScreenClust HRM Software?

Normalization using Rotor-Gene ScreenClust HRM Software is required since HRM melt curves can have different starting points. Therefore the scale of each melt curve can be different. Comparison can only occur if all samples are on the same scale, so each curve needs to be normalized.


FAQ ID -2198
What are Principal Components analyzed in Rotor-Gene ScreenClust HRM Software?

Principal component analysis is a well-established method of data analysis for multivariate data sets, such as obtained from, e.g.,  microarray analysis or image analysis. However, it is new in ScreenClust for HRM data. Principal Components (PCs) are extracted from the residuals plot so that the first Principle Component (PC1) represents the greatest variability or difference between all samples. The second (PC2) represents the regions of difference not already present in PC1. The third (PC3) represents differences not in PC1 and PC2.


FAQ ID -2200
Which mode should I use in the Rotor-Gene ScreenClust HRM Software, supervised or unsupervised?

The supervised mode in the Rotor-Gene ScreenClust HRM Software is designed for data sets with a known number of clusters where each cluster has defined controls. All samples will be grouped into one of the defined clusters.

The unsupervised mode is used if there are no controls for each cluster or if the number of clusters is not known. Based on the data presented, ScreenClust will return the recommended number of clusters and whether to separate the data in 2D or 3D. A user may choose to change either of both of these values.


FAQ ID -2202
What are clusters analyzed in the Rotor-Gene ScreenClust HRM Software?

Clusters analyzed in the Rotor-Gene ScreenClust HRM Software are groups of samples with the same melt characteristics. For example, in a single nucleotide polymorphism (SNP) analysis the clusters may represent the genotypes 'wild type', 'mutant' and 'heterozygote'. ScreenClust is designed to group samples into clusters after they are separated based on differences in their melt curves. The clusters can either be defined by control samples (supervised mode) or ScreenClust can determine the appropriate number of clusters (unsupervised mode).


FAQ ID -2201
What is the residuals plot in the Rotor-Gene ScreenClust HRM Software?

Once all melt curves are normalized, they are on a comparable basis. To make the information within each curve more useful for comparison, each curve is differentiated. The Residuals Plot is a plot of the difference between each sample and the composite median of all the samples after differentiation. The Residuals Plot of the Rotor-Gene ScreenClust HRM Software is different from a "Difference Plot" known from standard HRM software packages.


FAQ ID -2199