Digital PCR protocol — overview
Sample preparation – dPCR assay

Sample purity
Because PCR depends on multiple rounds of enzymatic reactions, it is more sensitive to impurities such as proteins, phenol/chloroform, salts and EDTA than single-step enzyme-catalyzed reactions. The purity of nucleic acid templates is important for dPCR because contaminants can interfere with fluorescence detection.
- Alcohols (ethanol, isopropanol) and salts impair primer and probe annealing properties and reduce the efficiency of amplification, e.g., reduced fluorescence of positives and impeded discrimination of positive and negative partitions
- Humic acids quench the fluorescence of dsDNA-binding dyes, e.g., EvaGreen
- Nucleases degrade RNA and DNA
- Urea and phenol denature the Taq polymerase
- Acidic polysaccharides mimic nucleic acids and form dead-end complexes with the Taq polymerase
Despite being less prone to inhibitory effects than qPCR, dPCR works optimally using templates with high template purity. Various kits exist to achieve high nucleic acid purity and PCR efficiency depending on the template, such as genomic DNA, plasmid DNA, total RNA, etc.
Sample integrity: Length and sequence
Amplicon length and sequence have as much influence as template purity in determining the success of a dPCR experiment. Strongly degraded template RNA and DNA tend to show a discrepancy between OD-quantified DNA amount and the number of copies amplified and detected by dPCR. A larger-than-expected DNA amount might be necessary to achieve desired sensitivity (e.g., in mutation detection). It is advisable to keep amplicons as short as possible, particularly when using strongly degraded samples (FFPE DNA, cfDNA).Similarly, residual crosslinks may prevent strand separation and amplification and abasic sites can induce unspecific amplification. Dedicated kits and protocols are available for the recovery of high-quality gDNA from FFPE samples.

It is recommended to use restriction digestion prior to the digital PCR assay in any of these cases:
- Highly viscous solutions – High viscosity could decrease the accuracy of measurement, especially when using larger amounts of DNA in smaller volumes. By using restriction digestion to reduce viscosity, much higher DNA concentrations (1 µg) could be used in the dPCR protocol.
- Linked or tandem gene copies – If one positive partition contains multiple copies, the linked copies would be counted as one copy. This problem can be overcome using restriction digestion to physically separate gene copies to independently segregate into partitions.
- Supercoiled plasmids – Restriction digestion is recommended to linearise the plasmid DNA and improve accessibility and efficiency of primer/probe binding to the DNA. This improves the accuracy of the plasmid quantification.
- Large DNA molecules (>30 kb) – Larger DNA molecules could be unevenly partitioned, leading to over-quantification of template concentration. Restriction digestion helps fragment the large templates into smaller sizes, which results in even distribution and more accurate quantification.
Sample input amount
The sample input amount depends on the dPCR technology used. In QIAcuity nanoplate digital PCR, up to 217,000 copies per reaction can be used in 26k nanoplates and up to 170,000 copies in 8.5k nanoplates.How to calculate the copy number
If the haploid genome size of an organism is known, the correlation between the mass input of genomic DNA (gDNA) and the resulting copy number (for a single-copy gene) can be calculated with the following formula:
Size of the genome (bp) x average weight of a single base pair (1.096 x 10⁻²¹ g/bp)
For example, for the human genome with a genome size of approximately 3.3 x 10⁹ bp, the calculation is as follows:
3.3 x 109 bp x 1.096 x 10−21 g/bp = 3.3 x 10⁻¹² g = 3.3 pg
The table below shows the copy number from 10 ng of gDNA from several model organisms
| Organism | Genome size | Gene copies (1 copy/haploid genome) in 10 ng gDNA |
|---|---|---|
| Homo sapiens | 3.3x10⁹ | 3000 |
| Zebrafish | 1.7x10⁹ | 5400 |
| Saccharomyces cerevisiae | 1.2x10⁷ | 760,500 |
| Escherichia coli | 4.6x10⁶ | 2,000,000 |
| Standard plasmid DNA | 3.5x10³ | 2,600,000,000 |
Replicates
It is recommended to analyze samples in duplicate or triplicate to prevent bias in quantification due to pipetting errors. Adding the data from duplicates together increases the number of measured events. This helps increase the precision of the digital PCR assay.
Controls
- Negative controls – needed to monitor false-positive reactions, which could arise due to contamination or problems with the primers and probes. Negative controls are also used to determine the limit of detection (LOD).
- Positive controls – used to test if the template amplification occurs under the set reaction conditions
- Non-template controls (NTCs) – control contamination in all reagents
Detection chemistry


dPCR primer design

Storage of primers and probes
Apart from careful assay design and the use of appropriate primer and probe concentrations, the correct storage of primers and probes is also critical to the success of dPCR.
Lyophilized primers and probes should be dissolved in a small volume of low-salt buffers, such as 100 µM TE buffer (10 mM Tris·Cl, 1 mM EDTA, pH 8.0) to give a concentration stock solution. As an exception, probes labeled with Cy5 and Cy5.5 fluorescent dyes should be stored in Buffer TE, pH 7.0 because they tend to degrade at higher pH.
To store the primers, small aliquots in nuclease-free TE buffer can be stored at -20°C for at least 1 year. Fluorescently labeled probes are stable under these same conditions for 6 to 9 months. Repeated freeze-thaw cycles should be avoided to reduce the risk of degradation.
For primer-probe sets used in dPCR multiplex assays, 20x primer-probe mixes could be used, with 2 primers and 1 probe for a particular target at the suggested concentrations.
To reconstitute primers and probes, a tube containing a lyophilized primer or probe should be centrifuged gently to collect all material at the bottom of the tube. The required volume of sterile, nuclease-free TE buffer should be added, mixed, and left for 20 minutes to allow the primer or probe to completely dissolve. The primer or probe solution should be mixed again and the concentration determined by spectrophotometry. A dPCR troubleshooting tip is to avoid dissolving the primers and probes in water. Some of these primers and probes have lower solubility and stability in water than in TE buffer.
Performing a dPCR run

Tips for sample loading
The first of the three dPCR reaction steps is to prepare and load the sample. During the preparation of the PCR mix and loading of the nanoplate, the following recommendations can be considered:
- Decontaminate your workspace and labware to reduce the risk of foreign DNA contamination
- To ensure maximal PCR efficiency, test the sample in different dilutions prior to the main digital PCR assay
- Fully thaw all components before preparing reaction mixtures and mix components thoroughly to obtain homogeneous solutions and centrifuge briefly to avoid spillovers.
- Combine master mix with the sample, primers, RNAase-free water and restriction enzymes if using any
- Use sterile pipette tips
- Pipette the reaction mixture into the nanoplate. Make sure no bubbles are introduced into the wells of the dPCR nanoplate during sample transfer and downstream transportation of the plate
- To prevent evaporation and contamination, use a roller to carefully seal the nanoplate with foil
- Carry nanoplate over to the dPCR instrument by only holding the side edges of the plate and avoiding shaking or turning to ensure the dPCR reaction mix stays at the bottom of the input wells
- Set up software and start the dPCR run
Tips for amplification
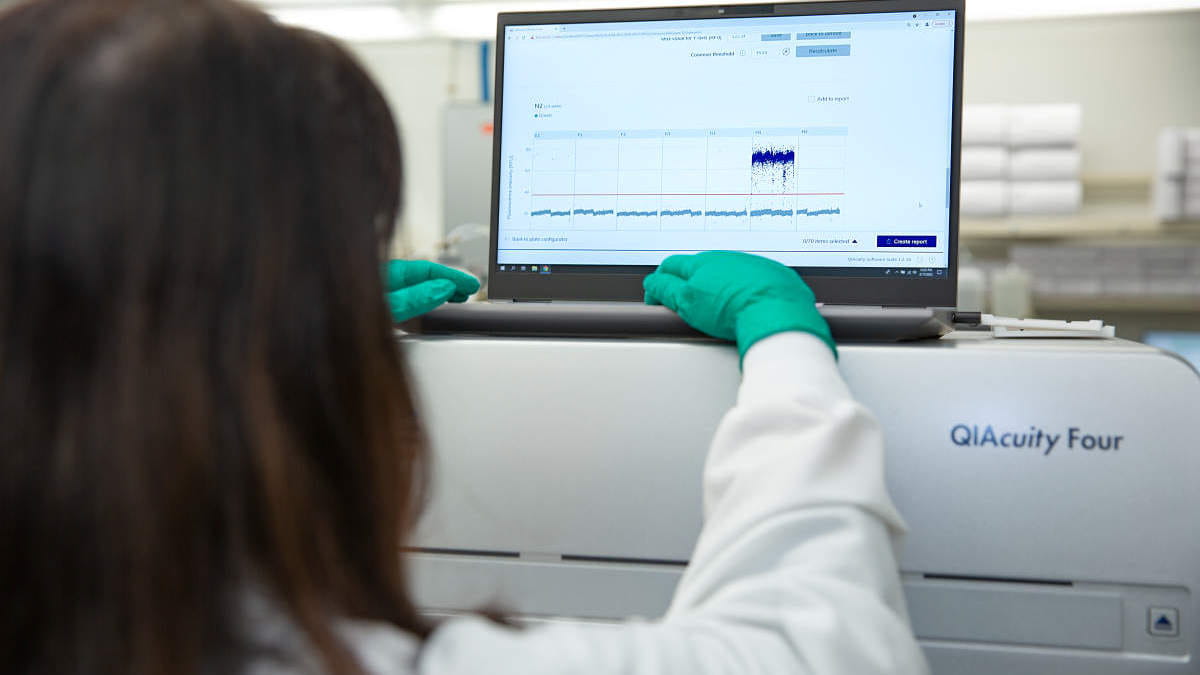
The second of three dPCR reaction steps is to run the dPCR protocol through amplification. During this step, the reaction mix of each well is segregated into thousands of individual reactions. The PCR reaction is performed in a thermocycler. If template material is present within a partition, a positive fluorescence signal is detected during imaging. The images are processed by dedicated software. The current plate status can be monitored, typically on the dPCR instrument itself or using the connected software suite.
Tips for achieving optimal amplification conditions and PCR efficiency include:
- Annealing temperature – can influence the dPCR assay specificity, typically set between 55°C and 65°C, the optimal annealing temperature is obtained when the largest separation between positive and negative partitions is achieved; increasing the annealing temperature might be beneficial in improving the separation between positive signals and background noise
- Amplification cycles – it is recommended to run 40 amplification cycles in order to achieve sufficient separation between positive signals and background noise. In some cases, the number of thermal cycles may have to be increased to achieve optimum performance
Digital PCR data analysis
In the last of the three dPCR reaction steps, digital PCR data analysis is performed with absolute quantification based on Poisson statistics.
The QIAcuity Software Suite can perform digital PCR data analysis according to application aims: absolute quantification, mutation detection, genome editing, copy number variation or gene expression. In absolute quantification analysis (first-level analysis), the software generates a concentration diagram and a view of positive and negative partitions for selected wells. A heatmap view shows the target channel alongside the reference channel. Histograms and scatterplots can be used to change threshold settings and recalculate results. In the QIAcuity Software Suite, you can create reports about the analysis results of your plate. Absolute quantification is the prerequisite for all subsequent calculations and second-level analyses (e.g., mutation detection analysis, gene expression analysis, copy number variation analysis, etc.).
Tips for digital PCR data analysis:
- Set a threshold for the classification of partitions as positive or negative just above the cluster of negative partitions
- Use the NTC sample, with only negative partitions, to help in setting the threshold, but also perform an inspection of all wells
- You can set the fluorescence amplitude of individual wells slightly higher or lower than NTCs to avoid misclassification of some partitions
- Although no consensus value exists, a reaction is normally considered positive when the number of positive partitions exceeds 2
- To address well-to-well and batch-to-batch variability, use volume precision factor (VPF) to define the exact volume of each well and apply the factor for concentration calculations by your software
Examples of digital PCR data
Digital MIQE (dMIQE) guidelines

The items in the dMIQE guidelines checklist are considered essential to report when publishing dPCR results. The information that needs to be reported includes, but is not limited to:
- Mean DNA target copies per partition (λ)
-
Number of partitions used (together with the mean DNA target copies, these values can determine the precision of the dPCR assay)
-
Template structural information, as the nature of the sample could affect data accuracy and reliability:
- Individual partition template type: genomic, plasmid, etc.
- Source: organism, tissue, cell, food, plant, etc.
- Treatment: Restriction digestion, sonication, pre-amplification, dilution, none
- Individual partition volume, as this volume could vary across dPCR platforms
- Total volume of reaction, which can be calculated by multiplying the number of partitions by the partition volume
- Types of controls used
- Representative amplification plots or endpoint fluorescence values of positive and negative experimental data
- Example experimental variance, preferably from multiple biological replicates to more accurately capture experimental uncertainty
- Others
How to transfer and optimize assays from qPCR to dPCR
Parameters for dPCR assay optimization
| Condition | Variable effect on | Range |
|---|---|---|
| Annealing temperature | •Specificity •Separation of positive and negative partitions •Assay artifacts |
•Theoretical or working Ta +/– 2.5ºC |
| Primer/probe concentration | •Separation of positive and negative partitions (increase positive signal or decrease negative signal) |
•0.8 µm primer; 0.4 µm probe (starting point) |
| Thermal cycling steps | •Remove intermediate partition signal | •2 or 3 (inclusion of 72ºC elongation) |
| Number of thermal cycle repeats | •Remove intermediate partition signal | •30–60 repeats |
However, when onboarding a new assay, an initial pilot test is always recommended to assess performance. It is also advisable to use well-characterized and representative controls in an appropriate background matrix. The assay should be optimized to ensure analytical accuracy if performance is sub-optimal. In such cases, reporting details of the optimization process is critical for reproducibility.
For fast optimization of sub-optimal assays, by running a temperature gradient during the annealing steps, the QIAcuity master mixes can also be run on any real-time PCR instrument.
Digital PCR troubleshooting
dPCR experiments can be affected by similar issues as qPCR or traditional or conventional PCR. However, there are some specific challenges that could arise when performing a digital PCR assay. The table below serves as a dPCR troubleshooting guide for commonly encountered problems in a typical dPCR protocol, outlining possible causes and our expert recommendations.
| Problem | Possible causes | Our recommendations |
|---|---|---|
| No negative partitions | If NTC wells have negative partitions: The sample’s target concentration is too high |
Run a dilution series to determine the optimal amount of input DNA |
| If NTC wells have only positive partitions: Probe hydrolysis due to poor long-term storage of probe stock solution or premature probe cleavage by the polymerase |
Reorder probe and make new probe stock solution or identify intra-assay interactions, redesign dPCR assay components to reduce binding and cleavage |
|
| No positive partitions | Restriction enzyme might have cut within the target sequence |
Test the dPCR assay against DNA digested with a different restriction enzyme and undigested DNA |
| The target sequence is part of a secondary structure or contains loops, repeats, high G/C content |
Re-design for another target; use a restriction enzyme to fragment input DNA (without cutting in the target sequence itself) |
|
| The amplification conditions are not optimal | Perform an annealing/extension temperature gradient to determine the optimal temperature for the digital PCR protocol; adjust physical parameters (elongation time, etc.) |
|
| Partial dPCR inhibition | Change method/kit for purification of nucleic acids; consider adding facilitator, such as BSA |
|
| Primers or probes do not match the target region as anticipated |
Ensure no errors were made during dPCR assay design or synthesis of primers/probes |
|
| Positive signal from NTC wells | Template/amplicon contamination in the reagents |
Wipe down pipettes, tip boxes and bench tops with 5–10% bleach; prepare samples and perform dPCR in separate rooms; wear appropriate personal protective equipment; dUTP containing mixes together with heat-labile uracil N-glycsolyase (UNG) could reduce number of false positives arising from contaminating PCR products, but have no effect on contaminants originating from the template |
| Low number of positives | Poor DNA purification | Use only purified DNA; try alternative method/purification kit |
| Improper sample or nanoplate loading | Do not overload or underload sample DNA; pipette carefully, ensure entire dPCR mix has been transferred to nanoplate; ensure sample remains at bottom of the input wells |
|
| Wrong primer concentration | Use recommended primer and probe concentrations | |
| Evaporation from nanoplate during amplification |
Seal nanoplate carefully (also around edges) using roller and foil | |
| Bubbles in input wells; | Pipette carefully; transport nanoplate by holding on the side edges only; do not drop or invert nanoplate |
|
| disturbance or improper sample transfer into nanoplate (so not all sample is collected at bottom of the input wells) |
||
| No clear separation between positive and negative partitions |
Suboptimal amplification conditions | Increase the number of cycles (but do not exceed 50 cycles); increase elongation time to 2 minutes, denaturation time to 1 minute (especially important for longer amplicons); perform a serial dilution to determine optimal amount of input DNA |
| Inability to separate positive and negative partitions when working with EvaGreen |
Excessive amount of primer or DNA starting material |
Use primers at recommended concentrations; do not overload starting material |
| Fragment length is too long | Homogenize fragment length by restriction digestion | |
| Appearance of background “rain” (partitions that fail to belong to the positive or negative population) |
Nonspecific binding | Do not overload primers; try increasing annealing temperature, reducing number of cycles, decreasing extension and annealing time; ensure reagents are free of impurities |
| Poor target accessibility | Use restriction digestion (avoid cutting your target sequence) or sonicating; to address RNA secondary structures: try to change target location or perform reverse transcription at warmer temperatures |
|
| Late PCR onset due to partial inhibition of some partitions |
Reduce amount of sample loaded; dilute sample further; change method or kit for nucleic acid purification |
|
| Appearance of noise (clusters of negative points above threshold) |
Solid or bubble contaminants | Take extra care when preparing nanoplate; examine results manuall to make sense of them if possible |
| Optical issues with instrument | Ensure your dPCR system has superior optics technology with high optics stability |
|
| Appearance of extra unexpected cluster |
A sequence variant of the target of the interest |
If the unexpected cluster is not desired: set threshold above cluster to exclude it from quantification, increase annealing temperature to improve specificity, digest with restriction enzyme to cut nonspecific target, re-design primer or probe to reduce complementarity to off-target sequence; if cluster represents a potential functional homologue, consider lowering the annealing temperature so the two clusters merge into one cluster |
| No concentration measurement in some wells |
Problem with assembly of reaction mixture or sample preparation |
Ensure dPCR assay is properly set up and DNA input and purity is satisfactory |
| Poor handling of the nanoplate during transport (shaking, dropping) |
Exercise extra care during sample preparation, pipetting dPCR reaction mix into nanoplate, handle nanoplate only by side edges, and avoid inverting, shaking, dropping prior to loading into dPCR system; if possible, manually set a threshold on the software to calculate a certain concentration |
|
| Improper plate sealing (evaporation from sides) |
Carefully seal the plate with foil using a roller | |
| Measured concentrations are too low | Poor dPCR assay design | Run a temperature gradient experiment to make sure the dPCR assay is running at optimal conditions; verify fluorophore is not conjugated to a G residue; add primers and probes at recommended concentrations |
| Poor target accessibility | Use restriction digestion (avoid cutting your target sequence) or sonicating |
|
| Presence of PCR inhibitors in samples | Change method/kit for purification of nucleic acids; add facilitator, such as BSA |
|
| Large error bars (inconsistent results) | Poor mixing of reaction mixtures | Thoroughly mix the reaction mixtures |
| Problems with temperature uniformity of thermal cycler |
Raise the denaturation temperature from 94 to 96°C for the first five cycles |
More support with dPCR optimization
References
Iowa Institute of Human Genetics – Droplet Digital PCR (accessed January 20, 2023)
Lindner L et al. Reliable and robust droplet digital PCR (ddPCR) and RT-ddPCR protocols for mouse studies. Methods. 2021; 191(4):95-106.
QIAGEN. QIAcuity User Manual Extension. June 2021.
Schrader C, Schielke A, Ellerbroek L, Johne R. PCR inhibitors – occurrence, properties and removal. Journal of Applied Microbiology. 2012; 113(5):1014-1026.
Sidstedt M, Rådström P, Hedman J. PCR inhibition in qPCR, dPCR and MPS – mechanisms and solutions. Analytical and Bioanalytical Chemistry. 2020; 412:2009-2023.
The dMIQE Group and Hugget JF. The Digital MIQE Guidelines Update: Minimum Information for Publication of Quantitative Digital PCR Experiments for 2020. 2020; Clin Chem 66(8):1012-1029.