
✓ 24/7 automatic processing of online orders
✓ Knowledgeable and professional Product & Technical Support
✓ Fast and reliable (re)-ordering
Rotor-Gene ScreenClust HRM Software
Cat. No. / ID: 9020147
Software CD, user guide
The Rotor-Gene ScreenClust HRM Software is intended for molecular biology applications. This product is not intended for the diagnosis, prevention, or treatment of a disease.
✓ 24/7 automatic processing of online orders
✓ Knowledgeable and professional Product & Technical Support
✓ Fast and reliable (re)-ordering
Features
- Innovative mathematical approach to HRM analysis
- Highly accurate identification of genotypes in supervised mode
- Automatic detection of new mutations in unsupervised mode
- Robust statistics for classifying and interpreting HRM data
- Minimal effort and standardized processes for data interpretation
Product Details
Rotor-Gene ScreenClust HRM Software is a powerful tool for analysis of high-resolution melting (HRM) data from the Rotor-Gene Q or Rotor-Gene 6000 cycler. By grouping samples into clusters, Rotor-Gene ScreenClust HRM Software enables applications such as genotyping and mutation screening.
Note: Rotor-Gene ScreenClust HRM Software is compatible with Windows 7 but is not supported by operating system versions after Windows 7, such as Windows 10.
Performance
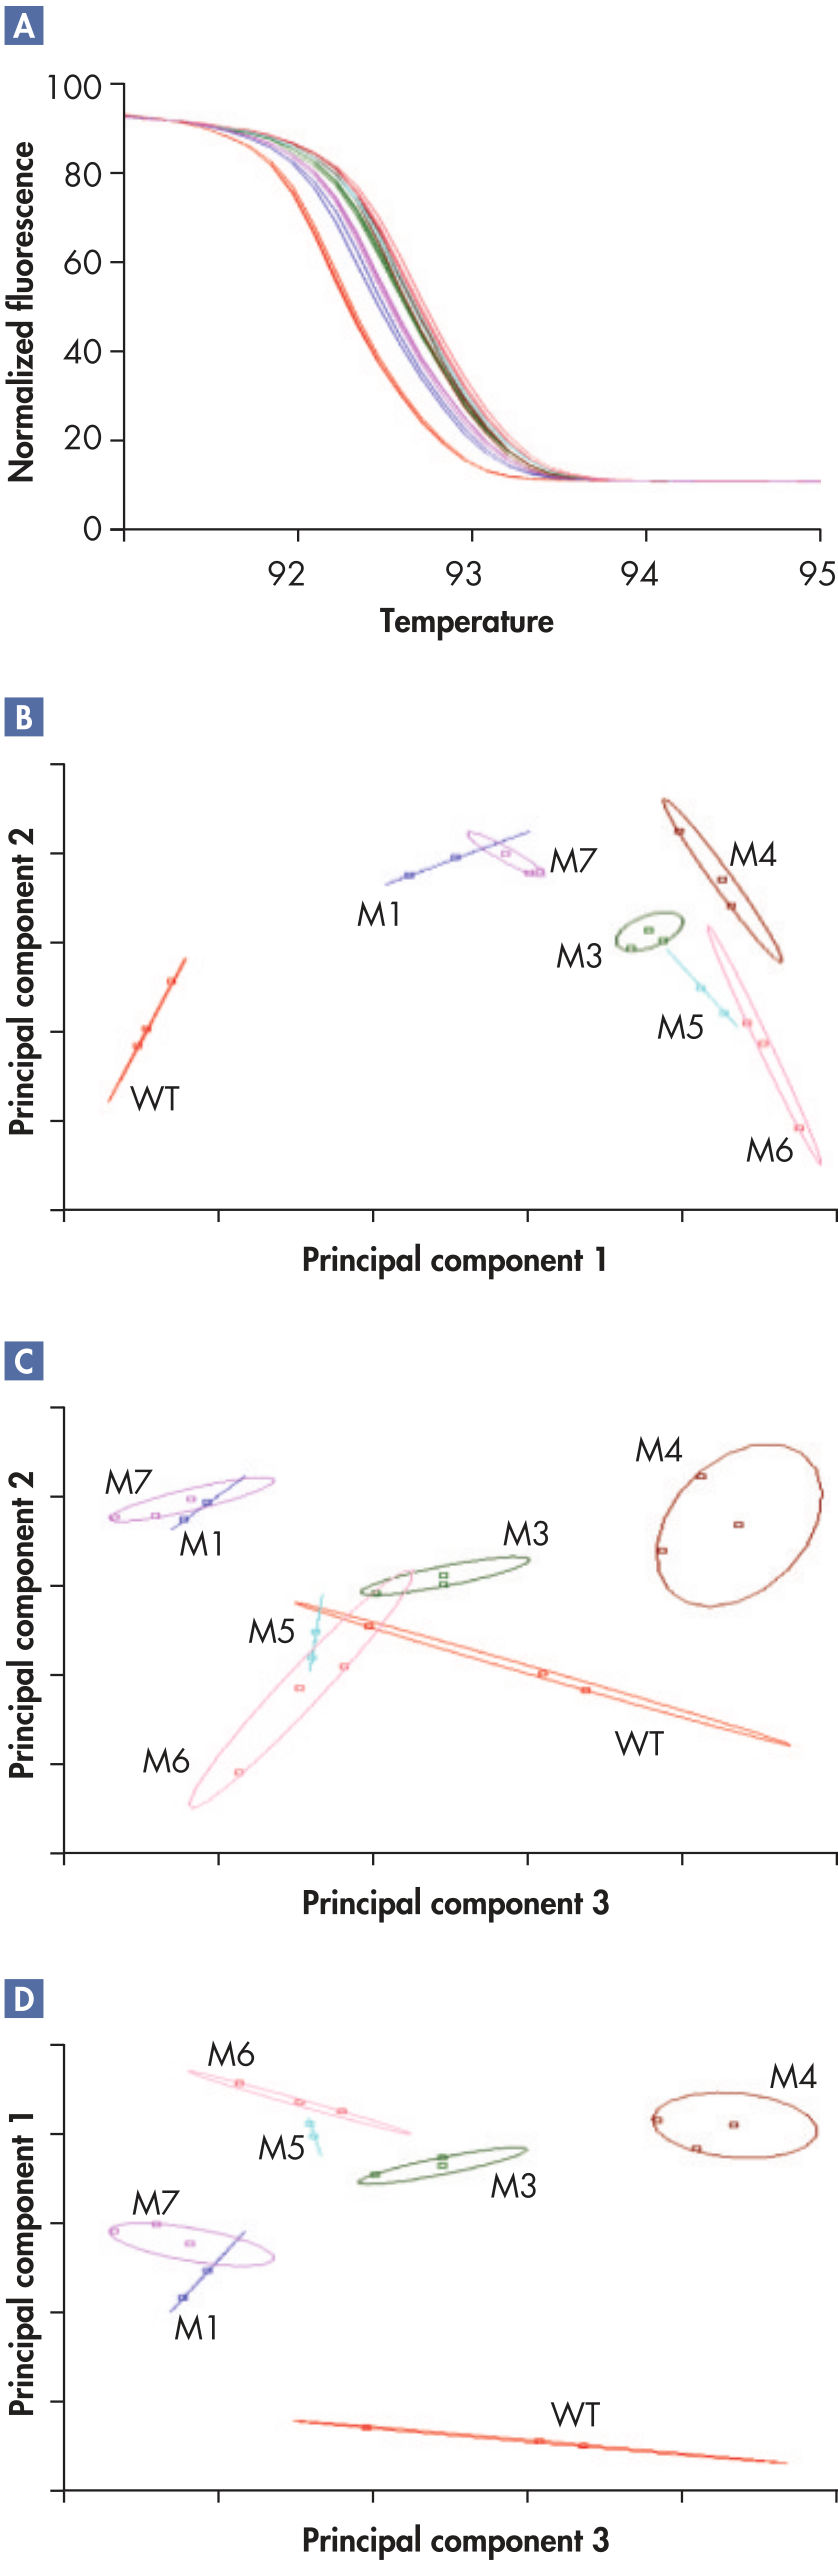
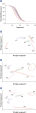
These Rotor-Gene Q cycler, in combination with Rotor-Gene ScreenClust HRM Software, enables identification of even difficult class IV A/T SNPs which can have differences in melting temperatures as low as 0.1°C (see figure " Identification of a class IV SNP").
In this mutation detection experiment, various gene mutations resulting form insertions/deletions in the EGFR gene exon 19 were analyzed (see figure " Successful mutation detection"). Rotor-Gene ScreenClust HRM Software accurately separated multiple close and partially overlapping melt profiles by successfully extracting data characteristics into the 3 first principal components. All 6 pseudo-unknowns and the wild-type sample were correctly identified.
See figures

Principle
HRM is an innovative technique that characterizes double-stranded PCR products based on their melting (dissociation) behavior as they transition from double-stranded DNA (dsDNA) to single-stranded DNA (ssDNA) with increasing temperature. First, the target sequence is amplified by PCR to a high copy number. Next, high-precision melting of PCR products enables discrimination of samples according to sequence, length, GC content, or strand complementarity, down to single base-pair changes. No prior sequence information is needed, enabling detection of previously unknown and even complex sequence variations in a simple and straightforward way.
Reliable HRM analysis requires a suitable HRM instrument, chemistry, and data analysis software. The Rotor-Gene Q cycler has a unique rotary design that provides outstanding thermal and optical performance, making it ideal for use in HRM analysis. The Type-it HRM PCR Kit provides optimized chemistry for accurate resolution of sequence variations and unambiguous allelic discrimination. Rotor-Gene ScreenClust HRM Software enables reliable interpretation of data.
HRM data analysis discriminates between genotypes by comparing the position and shape of melting curves of different samples. Melting curves of heterozygotes and homozygotes differ in their shapes and melting points (Tm). In standard HRM software packages, variations in melt curve shape and position compared to a control are used to differentiate between samples. This method can cause unreliable, difficult-to-interpret results, and time-consuming manual data interpretation may be necessary. In contrast, Rotor-Gene ScreenClust HRM Software uses innovative mathematical algorithms to characterize samples and group them into clusters.
Procedure
Rotor-Gene ScreenClust HRM Software analyzes HRM data in 4 steps:
- Normalization
- Generation of a residual plot
- Principal component analysis
- Clustering
The software guides the user through all the steps, giving information about any choices that can be made at each step.
HRM performed on the Rotor-Gene cycler produces raw data (*.rex files) that can be further analyzed using Rotor-Gene ScreenClust HRM Software. In the first step in analysis, raw data are normalized by applying curve scaling to a line of best fit so that the highest fluorescence value is equal to 100 and the lowest is equal to zero. Next, the curves are differentiated and a composite median curve is constructed using the median fluorescence of all samples. The melt traces for each sample are subtracted from this composite median curve to draw a residual plot. The individual sample characteristics are extracted by principal component analysis from the residual plot. Principal component analysis is a well-established method of data analysis. However, Rotor-Gene ScreenClust HRM Software is the first software application to apply principal component analysis to HRM data. Principal component analysis highlights similarities and differences in the data and is used to create a cluster plot in supervised or unsupervised mode (see figure " Identification of a class IV SNP"). Clustering (grouping) of data is performed according to allele.
Supervised mode is often used for SNP genotyping, where the genotypes are known. In supervised mode, the user assigns one or more control samples for each cluster and the software classifies (autocalls) all unknown samples to clusters according to their characteristics. The unsupervised mode is used to find new mutations in the data when there is no prior knowledge or only partial knowledge of the genotypes present in the samples. In unsupervised mode, the software calculates the optimum number of clusters by itself. This feature is an excellent tool for the discovery of new polymorphisms.
The result of analysis in both modes is displayed as an easy-to-interpret cluster plot (see figure "Identification of a class IV SNP"). Statistical probabilities and typicalities are provided to allow easy comparison of results from different experiments. All data and graphs can be conveniently exported in various formats such as JPG, PDF, CSV, or XLS file formats and are summarized in an experimental report.
See figures
Applications
HRM analysis using Rotor-Gene ScreenClust HRM Software provides enormous potential for a wide range of applications. SNP genotyping, and mutation scanning or detection experiments can especially benefit from the power of this technology.
Supporting data and figures
Identification of a class IV SNP.
Identification of a class IV SNP.
Resources
Brochures & Guides (1)
Instrument User Manuals (1)
Technical Information (1)
Safety Data Sheets (1)
Certificates of Analysis (1)
FAQ
What is the difference between probability and typicality in the Rotor-Gene ScreenClust HRM Software?
Why are some of my samples outside of the cluster using Rotor-Gene ScreenClust HRM Software?
Why are most of my samples outside of the cluster in supervised mode using Rotor-Gene ScreenClust HRM Software?
Why do I need normalization using Rotor-Gene ScreenClust HRM Software?
What are Principal Components analyzed in Rotor-Gene ScreenClust HRM Software?
Which mode should I use in the Rotor-Gene ScreenClust HRM Software, supervised or unsupervised?
What are clusters analyzed in the Rotor-Gene ScreenClust HRM Software?
What is the residuals plot in the Rotor-Gene ScreenClust HRM Software?